Download
1 / 26
270 likes | 367 Vues
No matter how sophisticated you may be, a huge granite mountain cannot be denied--it speaks in silence to the very core of your being. Ansel Adams Art completes what nature cannot bring to finish. Aristotle Art is lies that tell the truth. Picasso

E N D
No matter how sophisticated you may be, a huge granite mountain cannot be denied--it speaks in silence to the very core of your being. Ansel Adams Art completes what nature cannot bring to finish. Aristotle Art is lies that tell the truth. Picasso Science has not yet taught us if madness is or is not the sublimity of the intelligence. Edgar Allan Poe
Atmospheric Chemistry - Take 2 Energy equation in the atmosphere: E = hC/l Where l is radiation wavelength N2 + h 2N (l < 126 nm) DHo = 945 kJ mol-1 O2 + h 2O (l < 240 nm) DHo = 498 kJ mol-1 N2 (g) + O2 (g) 2NO (g) DGo = +173 kJ mol-1 Does not occur at ambient T but does at high T (engine combustion ~ 2500C) The reverse reaction is favored thermodynamically but too slow at ambient T (kinetics!) other reactions
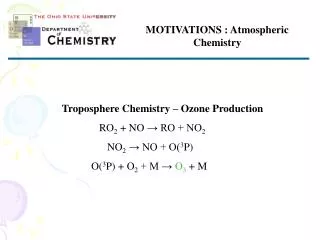
Atmospheric Chemistry - Tropospheric ozone 2NO + O2 2NO2 NO + O3 NO2 + O2
Atmospheric Chemistry - Tropospheric ozone The second partner needed in the ozone formation cycle are organic peroxides and free radicals (Organic molecules are emitted from forests and other plants but also from human sources - e.g. solvents or fuel at filling stations) CO + OH H + CO2 CH4 + OH CH3 + H2O CH3 + OH CH2 + H2O ROOH + OH ROO + H2O
Atmospheric Chemistry - Tropospheric ozone NO2 (h, l<400 nm) NO + O O + O2 + M O3 ROO + NO RO + NO2 NO + O3 NO2 + O2
Atmospheric Chemistry - Tropospheric ozone • If no nitrogen oxides are available, the reaction cycle cannot take place. • If too much nitrogen oxides are available the excess of nitrogen oxide NO reacts not only with the peroxy-radicals but removes the ozone again. • If no sunlight is available NO cannot be recycled again and the formation of peroxy-radicals is not sufficient.
Atmospheric Chemistry - Tropospheric ozone Urban traffic is not the only source of ozone They can come from other combustion processes: vegetations fires. NASA Earth Probe Total Ozone Mapping Spectrometer (TOMS) - Indonesian (Oct 1997)
Atmospheric Chemistry - Take 1 • Sources of CO and NOx Emissions in Europe • In Europe, in 2001, 30 679 Gg of CO was emitted. The main source of anthropogenic CO in the air was transportation (60%), and the industry contributed to 36% of the total emission. Waste management and agriculture were of marginal importance; • Transportation was also the main source of NOx as it delivered 63% of the total emission which amounted 10 056 Gg in 2001. Industry contributed to 35% of the total emission. Again, emissions from waste management and agriculture were of marginal importance.
Atmospheric Chemistry - Take 2 • Sources of HC and NOx Emissions in New England • Large industry such as chemical manufacturers, and combustion sources such as power plants burning fossil fuels; • Small industry such as gasoline-dispensing facilities, autobody paint shops, and print shops; • On-road automobiles, trucks and buses; • Off-road engines such as aircraft, locomotives, construction equipment and gasoline-powered lawn and garden equipment.
Atmospheric Chemistry - Take 2 Sequence of of chemical species appearing during a photochemical smog event.
Ozone formation and atmospheric conditions 10AM Source: USEPA - Region 1 (New England)
Change in regulation of ozone In July 1997, based on information that the 1-hour ground-level ozone standard did not adequately protect public health, EPA established the 8-hour ozone standard. Scientific information shows that concentrations of ozone in the air can affect human health at low levels and over longer exposure periods concentrations to 0.08 ppm, averaged over eight hours. The 1-hour standard limits ozone concentrations to 0.12 parts per million (ppm), measured in hourly readings. Much of New England was previously designated nonattainment under the the 1-hour standard.
Ozone formation and climate change Climate change can influence the concentration and distribution of air pollutants through a variety of direct and indirect processes: • modification of biogenic emissions • change of chemical reaction rates • mixed-layer heights that affect vertical mixing of pollutants, and • modifications of synoptic flow patterns that govern pollutant transport. For example, warmer temperatures can result in increased concentrations of photochemical oxidants and increased rate of O3 production.
Ozone formation and climate change • The frequency and duration of extreme ozone events is predicted to increase under the climate scenarios for future decades. Regional climate change was found to cause significant increases in the simulated 4th-highest 8-hr O3 concentration in summertime of future years. consider the effects of a changing climate when planning for the future attainment of regional-scale air quality standards such as the U.S. NAAQS (4th-highest annual daily maximum 8-hr O3 concentration).
Ozone formation and Reformulated Gasoline How should regulatory agencies determine if one RFG blend using a particular oxygenate is preferable to another? In attempting to mitigate ozone pollution, the USEPA currently addresses such questions by estimating the mass of VOC emissions resulting from the use of an individual RFG blend. If the estimated mass of emissions exceeds a specified amount, that fuel blend is disallowed. Although certain fuel blends, such as those using ethanol, might result in greater amounts of emissions in terms of mass (because of the volatility of ethanol), it is argued that those emissions have a lower ozone-forming potential compared with emissions from other fuel blends. Therefore should EPA's assessment of RFG blends be based not only upon mass of emissions, but also upon their reactivity (i.e., ozone-forming potential)?
Ozone formation and Reformulated Gasoline How should regulatory agencies determine if one RFG blend using a particular oxygenate is preferable to another? Peak ozone concentrations in 41 metropolitan areas in the United States decreased by about 10% overall from 1986 to 1997 despite growing fuel usage. Nevertheless, in 1997, about 48 million people lived in areas of the United States that were classified as ozone "nonattainment" areas, and promulgation of the new 8-hr National Ambient Air Quality Standard (NAAQS) of 0.08 parts per million (ppm) for ozone is projected to triple the number of counties in nonattainment and to result in extensive nonattainment in rural areas of the eastern United States. The persistence of ozone pollution has sparked a need for innovative approaches to mitigation, and the RFG program is one such attempt.
Ozone formation and Reformulated Gasoline Air-quality models suggest that implementation of the RFG program reduces peak ozone concentrations by only a few percent. Even if the relative contribution of motor vehicles to the current inventory of ozone precursor emissions from all sources has been underestimated (which, historically, has often been the case), the reduction in peak ozone from the RFG program would still likely be less than 10% at most. Although long-term trends in peak ozone in the United States appear to be downward, it is not certain that any part of these trends can be significantly attributed to the use of RFG. Source: National Academy of Science
Limit and Alarm Values • For nitrogen dioxide (NO2), sulphur dioxide (SO2), lead (Pb) and particulate matter of the diameter up to 10 µm (PM10), the limit values are given as mean annual concentration.. • For ozone (O3) and carbon monoxide (CO), the limit values are given as mean 8-hour concentration. • For NO2, SO2 and O3, apart from limit values, there are also alarm values established. Those are mean 1-hour concentrations. Source: Max Plank institute
This afternoon • Lab #3: Lead in Urban Regions: A temporal analysis.