Download
1 / 73
740 likes | 864 Vues
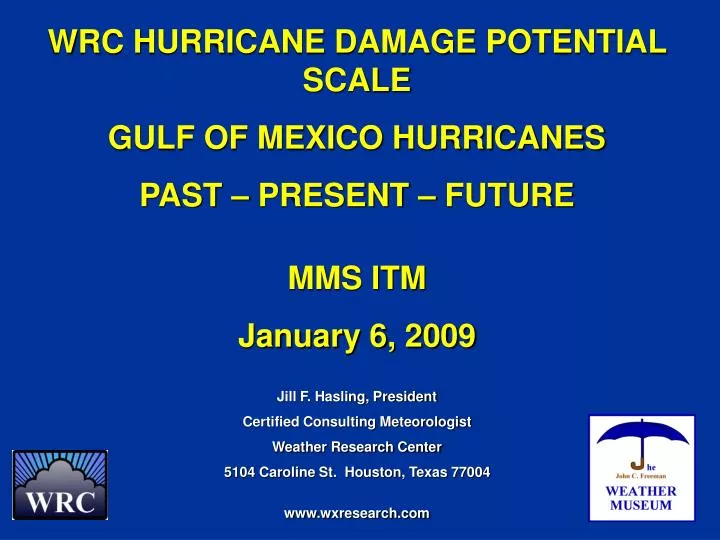
WRC HURRICANE DAMAGE POTENTIAL SCALE GULF OF MEXICO HURRICANES PAST – PRESENT – FUTURE MMS ITM January 6, 2009 Jill F. Hasling, President Certified Consulting Meteorologist Weather Research Center 5104 Caroline St. Houston, Texas 77004 www.wxresearch.com.

E N D
WRC HURRICANE DAMAGE POTENTIAL SCALE GULF OF MEXICO HURRICANES PAST – PRESENT – FUTURE MMS ITM January 6, 2009 Jill F. Hasling, President Certified Consulting Meteorologist Weather Research Center 5104 Caroline St. Houston, Texas 77004 www.wxresearch.com
Atlantic Basin Category 5 Hurricanes 31 Category 5 Hurricanes have occurred since 1900 Lowest Pressure – Hurricane Wilma 2005 - 882 mbs Highest maximum sustained winds – Hurricane Allen 1980 - 165 Knots Most Category 5 Hurricanes per season 2005 – (Four) – Emily, Katrina, Rita and Wilma 2007 – (Two) – Dean and Felix 1961 – (Two) – Carla and Hattie 1960 – (Two) – Donna and Ethel
Hurricane Strikes on the United States Mainland 1851-2007 Category Strikes 5 3 4 18 3 75 2 73 1 111 TOTAL 280 Major 96 Category 3 or higher at landfall
Hurricane Ike Just prior to landfall: Minimum central pressure was 952 mbs Maximum sustained winds were 95 knots gusting to 115 knots Radius of Hurricane force winds was 110 nm Radius of Tropical Storm force winds was 240 nm A pressure of 952 mbs usually indicates sustained winds of 108 knots.
Size of the windfield can change during the life of a hurricane. The windfield of Rita expanded as the storm weakened from a Category 5 hurricane.
WHY SIZE MATTERS! The distance the wind blows over a body of water [fetch] and the duration of the high winds, the higher the waves can become.
95 kts 64 kts 50 kts 34 kts
Other Parameters Not only the size matters but also the track through the oil leases, forward speed, duration [dependent on hurricane size] Most importantly the offshore properties that are exposed to the high waves.
The return of the intense hurricanes similar to the hurricanes of the 60’s, Hurricanes Ivan, Katrina, Rita and Ike demonstrate a need to create a model to estimate the hurricane damage potential in order to understand the hurricane threat to offshore properties. A quick look at the history of Gulf of Mexico exploration and production demonstrates this need.
The Oil Industry moved offshore into the Gulf of Mexico after World War II in 1947
Harris and Knox [1947] “In 100 feet of water, waves will probably seldom if ever, exceed 20 feet in height.” Decks thus should be placed “20 feet above the still water line”.
Harris and Knox [1947] “In 100 feet of water, waves will probably seldom if ever, exceed 20 feet in height.” Decks thus should be placed “20 feet above the still water line”. 1946-1948 – The first generation of fixed platforms placed decks from 20 to 40 feet above the mean level of the Gulf.
Harris and Knox [1947] “In 100 feet of water, waves will probably seldom if ever, exceed 20 feet in height.” Decks thus should be placed “20 feet above the still water line”. 1946-1948 – The first generation of fixed platforms placed decks from 20 to 40 feet above the mean level of the Gulf. In the late 40’s, Munk recommended a deck height of 32 feet with the expected maximum wave height of about 25 feet.
Harris and Knox [1947] “In 100 feet of water, waves will probably seldom if ever, exceed 20 feet in height.” Decks thus should be placed “20 feet above the still water line”. 1946-1948 – The first generation of fixed platforms placed decks from 20 to 40 feet above the mean level of the Gulf. In the late 40’s,Munk recommended a deck height of 32 feet with the expected maximum wave height of about 25 feet. October 1949 – Freeport Hurricane severely damaged a platform with 40 foot waves.
Harris and Knox [1947] “In 100 feet of water, waves will probably seldom if ever, exceed 20 feet in height.” Decks thus should be placed “20 feet above the still water line”. 1946-1948 – The first generation of fixed platforms placed decks from 20 to 40 feet above the mean level of the Gulf. In the late 40’s,Munk recommended a deck height of 32 feet with the expected maximum wave height of about 25 feet. October 1949 – Freeport Hurricane severely damaged a platform with 40 foot waves. During the 1949 Freeport Hurricane, a platform with a 26 foot deck suffered damages while a platform with a 33 foot deck showed no damage.
Observations from 1947 to 1952 suggested that the key problem was to keep the mammoth waves from cresting on the deck.
Observations from 1947 to 1952 suggested that the key problem was to keep the mammoth waves from cresting on the deck. 1956 September Hurricane Flossie – 110 mph winds and 15 to 20 feet waves. Numerous tenders broke their moorings. Damaged risers.
Observations from 1947 to 1952 suggested that the key problem was to keep the mammoth waves from cresting on the deck. 1956 September Hurricane Flossie – 110 mph winds and 15 to 20 feet waves. Numerous tenders broke their moorings. Damaged risers. 1957 June Hurricane Audrey – One mobile drilling rig sank. Four tenders suffered damages when their moorings were broken.
Observations from 1947 to 1952 suggested that the key problem was to keep the mammoth waves from cresting on the deck. 1956 September Hurricane Flossie – 110 mph winds and 15 to 20 feet waves. Numerous tenders broke their moorings. Damaged risers. 1957 June Hurricane Audrey – One mobile drilling rig sank. Four tenders suffered damages when their moorings were broken. 1957 September Hurricane Bertha – Moved inland near Cameron. One drilling tender sunk and 1 tender run aground.
Observations from 1947 to 1952 suggested that the key problem was to keep the mammoth waves from cresting on the deck. 1956 September Hurricane Flossie – 110 mph winds and 15 to 20 feet waves. Numerous tenders broke their moorings. Damaged risers. 1957 June Hurricane Audrey – One mobile drilling rig sank. Four tenders suffered damages when their moorings were broken. 1957 September Hurricane Bertha – Moved inland near Cameron. One drilling tender sunk and 1 tender run aground. More than 1,000 platforms had been built in the Gulf by the mid 60’s.
Until 1964, no major hurricanes moved over the areas of high concentrations of offshore operations. Three hurricanes Hilda (1964), Betsy (1965) and Camille (1969) demonstrated that the risks presented by major hurricanes was gravely underestimated.
Hurricane Hilda 1964 – 100 year Storm 13 platforms destroyed and 5 more damaged beyond repair Hurricane Betsy 1965 – 100 Year Storm 8 platforms destroyed and damaged others Hurricane Camille 1969 – 400 year Storm Shell measured waves of 70 to 75 feet
Central Pressure/Wind Relationship 960 mbs – Sustained winds of 100 knots – 115 mph – Cat 3 945 mbs – Sustained winds of 115 knots – 132 mph – Cat 4 931 mbs – Sustained winds of 128 knots – 147 mph – Cat 4 922 mbs – Sustained winds of 135 knots – 155 mph – Cat 4 914 mbs – Sustained winds of 142 knots – 163 mph – Cat 5
NOTABLE CATEGORY 5 GOM LEASE HURRICANES • 165 kts Hurricane Camille 1969 • 155 kts Hurricane Allen 1980 • 155 kts Hurricane Rita 2005 • 150 kts Hurricane Carla 1961 • 150 kts Hurricane Katrina 2005 • 140 kts Hurricane Beulah 1967 • 140 kts Hurricane Ethel 1960 • 135 kts Hurricane Betsy 1965
WRC Meteorologists • Computed the Maximum sustained windfields for the some of hurricanes over the GOM Leases • The windfields were then plotted using GIS Software
WRC Meteorologists then plotted a cross section to show the wind profiles and wave profiles for past hurricanes. As you can see from the profiles, each hurricane is a different size. Hurricane Andrew 1992 Hurricane Ivan 2004 Hurricane Katrina 2005 Hurricane Rita 2005 Hurricane Ike 2008