Download
1 / 22
230 likes | 380 Vues
Chaos. 69EG3137 – Impacts & Models of Climate Change. Details for Today: DATE: 9 th December 2004 BY: Mark Cresswell FOLLOWED BY: Nothing. Lecture Topics. Introduction Lorenz and chaos The attractor Bifurcation Mandelbrot and Helge von Koch Summary. Introduction.

E N D
Chaos 69EG3137 – Impacts & Models of Climate Change Details for Today: DATE: 9th December 2004 BY: Mark Cresswell FOLLOWED BY: Nothing
Lecture Topics • Introduction • Lorenz and chaos • The attractor • Bifurcation • Mandelbrot and Helge von Koch • Summary
Introduction • If atmospheric processes were constant, or strictly periodic, describing them mathematically would be easy…..weather forecasting would also be easy….and meteorology would be boring! • Instead, the atmosphere exhibits variability and fluctuations that are irregular • In order to deal quantitatively with uncertainty, it is necessary to use the tools of probability – the mathematical language of uncertainty
Introduction • Computer models generate deterministic solutions of the future state of the atmosphere • Such model solutions do not provide an estimate of uncertainty – if re-run with the same starting conditions, they generate the same solution • These models could NEVER generate forecasts with NO uncertainty because of their limited model physics and the fact some processes operate at very small spatial scales – far smaller than the finest resolution of the model
Lorenz and Chaos • Even if all relevant physics could be included in atmospheric models we would still not escape uncertainty because of dynamical chaos • This was a problem discovered by Ed Lorenz in 1963 - and effectively rules out any hope of an uncertainty-free forecast • Lorenz began to formulate his ideas on weather predictability and chaos from an accidental discovery in his lab
Lorenz and Chaos • What Lorenz observed was to become known as the butterfly effect The flapping of a single butterfly's wing today produces a tiny change in the state of the atmosphere. Over a period of time, what the atmosphere actually does diverges from what it would have done. So, in a month's time, a tornado that would have devastated the Indonesian coast doesn't happen. Or maybe one that wasn't going to happen, does. (Ian Stewart, Does God Play Dice? The Mathematics of Chaos, pg. 141)
Lorenz and Chaos • Lorenz found that the time evolution of a non-linear dynamical system (like the atmosphere) is very sensitive to the initial conditions of that system • If 2 realisations of the system are started from 2 very slightly different initial conditions, the two solutions will eventually diverge markedly
Lorenz and Chaos • Since the atmosphere is always incompletely observed, even a model with perfect physics will never start exactly like the real world – but will have gaps where initial conditions are unknown or slightly inaccurate • These small errors and unknown values will accumulate and be magnified over time such that model and reality diverge over time
The Attractor • Lorenz decided to produce an experimental set of equations to investigate chaos further • He took the basic equations for convection – and stripped them down to an unrealistically small equation that retained a sensitive dependence on initial conditions • Later, it was discovered that his equations exactly described the motion of a simple water wheel
The Attractor • The simple equations gave rise to entirely random behaviour – BUT when the results were graphed they showed something extraordinary • The output always stayed on a curve – a double spiral. Previously, only a steady state or perfectly periodic state was known about • Lorenz’s new state was ordered – but never repeated themselves nor followed a steady state
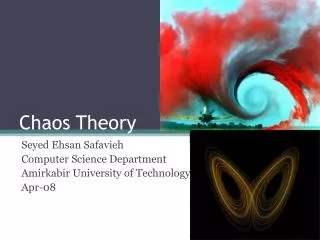
The Attractor • When output from Lorenz’s equations are visualised, we see a strange attractor…. • Now known as the Lorenz Attractor
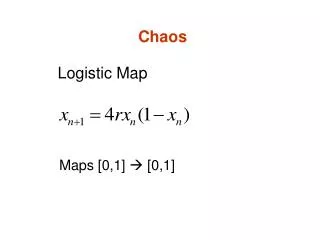
Bifurcation • A similar problem occurs in ecology, and the prediction of biological populations • The equation would be simple if population just rises indefinitely, but the effect of predators and a limited food supply make this equation incorrect…so the simplest equation taking this into account is: next year's population = r * this year's population * (1 - this year's population) r = growth rate
Bifurcation • A biologist, Brian May decided to change the growth rate and plot the results graphically • As the growth rate increased, the final population would increase as well • But…strangely.. As the rate passed a threshold the line broke into 2 and became 2 different populations • As the rate increased, the populations would break again – but unpredictably – chaotically!
Bifurcation Bifurcation Upon closer inspection, it is possible to see white strips. Looking closer at these strips reveals little windows of order, where the equation goes through the bifurcations again before returning to chaos
Mandelbrot • An employee of IBM, Benoit Mandelbrot was a mathematician studying the self-similarity of May and Lorenz’s work • One of the areas he was studying was cotton price fluctuations • No matter how the data on cotton prices was analysed, the results did not fit the normal distribution. Mandelbrot eventually obtained all of the available data on cotton prices, dating back to 1900
Mandelbrot • The numbers that produced aberrations from the point of view of normal distribution produced symmetry from the point of view of scaling • Each particular price change was random and unpredictable. But the sequence of changes was independent on scale: curves for daily price changes and monthly price changes matched perfectly
Mandelbrot • At one point, he was wondering about the length of a coastline. A map of a coastline will show many bays. However, measuring the length of a coastline off a map will miss minor bays that were too small to show on the map • walking along the coastline misses microscopic bays in between grains of sand. No matter how much a coastline is magnified, there will be more bays visible if it is magnified more
Mandelbrot One mathematician, Helge von Koch, captured the ideas of Mandelbrot in a mathematical construction called the Koch curve. The Koch curve brings up an interesting paradox. Each time new triangles are added to the figure, the length of the line gets longer. However, the inner area of the Koch curve remains less than the area of a circle drawn around the original triangle. Essentially, it is a line of infinite length surrounding a finite area
Summary • Climate does repeat itself (consider the 4 seasons of Spring, Summer, Autumn and Winter) – but NEVER EXACTLY • Models cannot replicate a system if it is missing information about initial conditions • Uncertainty degrades predictability • Randomness and unknown forcings generate seemingly chaotic turbulence – but such randomness actually has order
Summary • We will NEVER be able to generate accurate weather forecasts or climate predictions because chaos arises from uncertainty • Improvements in model physics will have a limited effect (garbage in = garbage out) • Parallel improvements in observing systems will help to produce model simulations that see the influence of chaos occurring later in the integration – and hence providing longer lead-time forecasts