Download
1 / 17
170 likes | 301 Vues
Sales of Handloom Saris. An Application of Logistic Regression. Objectives. Illustrate importance of interpretation, domain insights from managers for interpretation and implementation

E N D
Sales of Handloom Saris An Application of Logistic Regression
Objectives • Illustrate importance of interpretation, domain insights from managers for interpretation and implementation • Relevance to situations where too many products (or services) but can define more stable underlying characteristics of products (or services) • Logistic Regression as a tool that parallels multiple linear regression in practice. Powerful analysis in a spreadsheet
Handloom Industry in India • Decentralized, traditional, rural, co-ops • Direct employment of 10 million persons • Accounts for 30% of total textile production
Co-optex (Tamilnadu State) • Large: 700 outlets; $30million; 400,000 looms • Strengths: – Design variety, short run lengths – Majority sales through co-op shops • Weaknesses: – Competing with mills difficult – Large inventories, high discount sales
Study Question • Improve feedback of market to designs through improved product codes • Assess economic impact of proposed code • Pilot restricted to saris – Most difficult – Most valuable
A Consumer-oriented Code forSaris • Developed with National Institute of Design
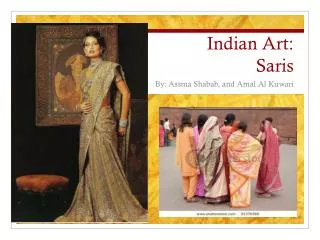
Sari components Body Border Pallav
Sari Code Body:Warp Color & Shade (WRPC, WRPS) Weft Color & Shade (WFTC, W FTS) Body Design (BODD) Border: Color, S hade, D esign, S ize (BRDC, BRDS, B RDD, B RDZ) Pallav: Color, S hade, D esign, S ize (PLV C, PLV S, P LVD, P LV Z)
Code Levels • Color (Warp, weft, border, pallav) 10 levels:0=red, 1=blue, 2=green, etc. • Shade(Warp, weft, border, pallav) – 4 levels: 0=light, 1=medium, 2=dark, 3=shiny; • Design (Body, border, pallav) – 23 levels: 0=plain, 1=star buttas, 2=chakra buttas, etc. • Size(Border, pallav) – 3 levels: 0= broad, 1=medium, 2=narrow
Assessing Impact Major Marketing Experiment • 14 day high season period selected • 18 largest retail shops selected • 20,000 saris coded, sales during period recorded • Logistic Regression models developed for Pr(sale of sari during period) as function of coded values.
Logistic Regression Model • Odds(Sale) = exp(ß0+ ß1WRPC_1 + ß2WRPC_2 + ß3WRPC_3 +ß4WRPC_4 + ß5PLVD_1 +ß6BRDZ_1+ ß7BRDZ_2)
Confusion Table(Cut-off probability = 0.5) Actual Predicted
Impact • Producing only saris that have predicted probability > 0.5 will reduce slow-moving stock substantially. In the example, slow-moving stock will go down from 65% of production to 25% of production • Even cut-off probability of 0.2 reduces slow stock to 49% of production
Insights • Certain colors and combinations sold much worse than average but were routinely produced (e.g. green, border widths-body color interaction) • Converse of above (e.g. plain designs, light shade body) • Above adjustments possible within weavers’ skill and equipment constraints • Huge potential for cost savings in silk saris • Need for streamlining code, training to code.
Reasons for versatility of LogisticRegression Models in Applications • Derivable from random utility theory of discrete choice • Intuitive model for choice-based samples and case-control studies • Derivable from latent continuous variable model • Logistic Distribution indistinguishable from Normal within ±2 standard deviations range • Derivable from Normal population models of discrimination (pooled covariance matrix) • Fast algorithms • Extends to multiple choices (polytomous regression) • Small sample exact analysis useful for rare events (e.g. fraud, accidents, lack of relevant data, small segment of data)