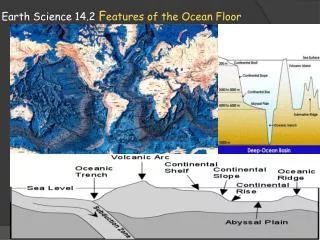
Download
1 / 26
260 likes | 389 Vues
Ocean Acidification of the Greater Caribbean Region/GOM John W. Morse 1 , Dwight Gledhill 2 , Rik Wanninkhof 3 , C. Mark Eakin 4 , Nina Keul 1 , Denis Pierrot 3. 1 Texas A&M 2 RSMAS, U, Miami 3 NOAA/AOML 4 NOAA/NESDIS Coral Reef Watch. Partners:. Ocean Acidification.

E N D
Ocean Acidification of the Greater Caribbean Region/GOM John W. Morse1, Dwight Gledhill2, Rik Wanninkhof3, C. Mark Eakin4, Nina Keul1, Denis Pierrot3 1Texas A&M 2RSMAS, U, Miami 3NOAA/AOML 4NOAA/NESDIS Coral Reef Watch Partners:
Ocean Acidification ≈ 48% of anthropogenic CO2 taken up by the ocean CO2 Sabine et al. Science (2004)
Ocean Acidification NOAA CMDL CCGG CO2 data at Mauna Loa, HI Derived surface (50 m) values obtained using on-line data available at http://hahana.soest.hawaii.edu/hot/hot-dogs/ and solved using the Lewis E. and Wallace D.W.R. (1998) Basic program for CO2 system in seawater. ORNL/CDIAC-105, Oak Ridge National Lab
Plant/Animal/Mineral Saturation State W > = 1 precipitation W = = 1 equilibrium W < = 1 dissolution Reef Community Slide after of Joan Kleypas, NCAR
Changing W and calcification Saturation State W > = 1 precipitation W = = 1 equilibrium W < = 1 dissolution Guinotte, J. M., R. W. Buddemeier, J.A. Kleypas (2003) Optimal Saturation state (Ω) describes the degree to which seawater is saturated with respect to carbonate mineral phases adequate Marginal Critical - Langdon & Atkinson (2005)
Predictions of Ocean Acidification Aragonite Saturation State (W) 1765 0 1 2 3 4 5 after Feely et al (in press) with Modeled Saturation Levels from Orr et al (2005) Image courtesy of Dan Pisut (NOAA VisLab)
Predictions of Ocean Acidification Aragonite Saturation State (W) 2100 0 1 2 3 4 5 after Feely et al (in press) with Modeled Saturation Levels from Orr et al (2005) Image courtesy of Dan Pisut (NOAA VisLab)
Controls on Mineral Saturation State Deriving W in Seawater Some Considerations…. www.wbgu.de
NOAA AVHRR+AMSR-E SST OI.2 • Real-Time Ocean Forecast System (Atlantic) http://www.ncdc.noaa.gov http://nomad5.ncep.noaa.gov/DOC/RTOFS.html Temperature & Salinity
Total Alkalinity Model Does Lee et al. (2006) work for the Greater Caribbean? Lee, K., L. T. Tong, et al. (2006). "Global relationships of total alkalinity with salinity and temperature in surface waters of the world’s oceans." Geophysical Research Letters33. Global Ocean Data Analysis
pCO2,sw Model * CO2 gas solubility (K0) calculated according to Weiss, 1974 • NOAA Atlantic Oceanographic and Meteorological Laboratory Global Carbon Group Explorer of the Sea’s Program • Underway pCO2,sw • Thermosalinograph (SST, SSS) • Sea level barometric pressure (SLP) r2 = 0.85, RMSD = 7.2 µatm, n=314395
Model Processing TCO2 SST CO32- SSS pH pCO2,sw HCO3- Alk W
http://coralreefwatch.noaa.gov/satellite/current/experimental_products.htmlhttp://coralreefwatch.noaa.gov/satellite/current/experimental_products.html GCR OA Product: Offers monthly synthesis of satellite and modeled environmental datasets to provide a synoptic estimate of sea surface carbonate chemistry in the Greater Caribbean Region. This tool compliments on-going geochemical surveys and monitoring efforts in the region by providing estimates of changing ocean chemistry on a broader spatial and temporal scale than shipboard observations alone can permit. • The annual mean arg is declining at a rate of -0.010 ± 0.001 arg yr-1 • The monthly mean arg varies seasonally by approximately 0.3 arg
http://coralreefwatch.noaa.gov/satellite/current/experimental_products.htmlhttp://coralreefwatch.noaa.gov/satellite/current/experimental_products.html
* • Model Bias for Co-Located Ship Data Gledhill et al., JGR 2008 Validated derived fields against geochemical cruise datasets from 1997 through 2006. Major Caveat: Very limited validation data available for the Caribbean Sea and NGOM
NASA ROSES-2007 Element A.3: Carbon Cycle Science ‘Ocean Acidification of the Greater Caribbean Region’ Project Objectives • Establish comprehensive dual carbonate parameter regional survey with emphasis on current prominent omissions (e.g. CS, NGOM). • Improve parameterize the Lee et al. (2006) TA-SSS relationships specific to the GCR/NGOM. • Evaluate performance of current empirical K0-based pCO2,sw model and incorporate biological (OC), gas-exchange (winds), ancillary (e.g. upwelling) effects. • Provide an enhanced characterization of seasonal and decadal distribution and changes in aragonite saturation state (W ).
Year 1 acquisition of in-situ carbonate chemistry • Caribbean Track (May, 2009) • Methanol Holdings (Trinidad) Limited (MHTL) methanol tanker • Underway LI-COR 6241 pCO2,sw • Autonomous TA sampler Las Cuevas
Model-ship comparisons Preliminary Findings While the distribution of aragonite saturation state is well captured in the Western Tropical Atlantic and Lesser Antilles waters, it significantly underestimates values for much of the NGOM region.
Key Assumption: TA - SSS A key assumption of the current model is that the Lee at al. (2005) TA-SSS relationship applies throughout the region. This is False!
ACDM, Aqua MODIS Interpolated from 8day; 9km, NASA MEaSUREs Ocean Color Product Evalution Project Garver-Siegel-Maritorena (GSM) model Maritorena, Siegel, & Peterson (2002) N = 44 33 27 Aqua MODIS ID of water type These differing water types can be readily distinguished by making use of L3 Aqua MODIS products currently available. Type 1: <0.01 m-1 Type 2: 0.01 < 0.04 m-1 Type 3: >0.04 m-1
Chlorophyll, Aqua MODIS Interpolated from 8day; 9km, NASA MEaSUREs Ocean Color Product Evalution Project Garver-Siegel-Maritorena (GSM) model Maritorena, Siegel, & Peterson (2002) N = 44 33 27 Aqua MODIS ID of water type These differing water types can be readily distinguished by making use of L3 Aqua MODIS products currently available. Type 1: <0.07 mg m-3 Type 2: 0.07 < 1.5 mg m-3 Type 3: >1.5 mg m-3
Type-specific TA - SSS When we inform the model using Aqua MODIS GSMacdm to distinguish the proper water type…
Type-specific TA - SSS We achieve considerably better agreement in type 2 waters.
Efforts have begun to couple satellite & in situ observations to characterize the regional distribution and the secular changes in aragonite saturation state in the GCR/NGOM. • Using this approach we can provide an important supplement to oceanic time-series stations and regular geochemical surveys in tracking ocean acidification in oceanic surface waters. • The combined effects of thermodynamics and variations in pCO2,sw and AT produce a dynamic and complex distribution in arg spatially and temporally across the GCR. • The approach characterizes well the arg distributions in the western tropical Atlantic and Lesser Antilles Region. • The Mississippi River delivers considerable amounts of alkalinity to the NGOM that precludes the application of Lee et al., (2006) (sub)tropical TA-SSS relation. • Aqua MODIS GSMacdm can be applied to readily distinguish appropriate application of specific TA-SSS relationships Summary
Data availability and latency NRT Revised SST SSS Sea Level Pressure Atmospheric CO2 SST SSS Sea Level Pressure Atmospheric CO2
Near-Real-Time Model relies on statistical forecast model of atmospheric CO2 mole fraction QC marine boundary layer from GLOBALVIEW requires ~1 year Statistical Forecast XCO2,air