Download
1 / 15
150 likes | 273 Vues
Results First Using Cost-Benefit Analysis to Analyze State Policy. August 6, 2012. Criminal Justice Cost-Benefit Analysis: Big Picture. Estimate the cost of crime in your state Police, Jails, Courts, Probation, Prison, Post-release supervision, Victimization

E N D
Results First Using Cost-Benefit Analysis to Analyze State Policy August 6, 2012
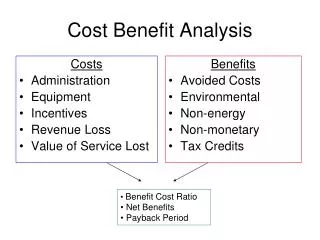
Criminal Justice Cost-Benefit Analysis: Big Picture • Estimate the cost of crime in your state • Police, Jails, Courts, Probation, Prison, Post-release supervision, Victimization • Examine programs/policies that reduce crime • Apply the costs of crime to the programs/ policies that reduce crime to estimate their monetary benefits
Results First Approach • Aggregate best national research to identify evidence-based programs that are effective • Estimate these programs’ impact if implemented, based on a state’s unique population characteristics • Use the state’s fiscal data to estimate total costs and benefits for each program • Built upon the Washington State Institute for Public Policy (WSIPP)’s benefit-cost model
Approach can be used in many ways • Consumer Reports – compare multiple programs • Prison Economics – examine the trade off between prisons and programs • Cost of Recidivism – identify the benefits of avoiding one recidivist • Same approach can be used in other policy areas
Estimated Convictions Avoided for FFT Participants Recidivism rates reduced by 22 percent 80% 70% 60% 50% WithoutFFT, an offender has a 72% chance of being reconvicted for a new felony or misdemeanor after 15 years; 40% Recidivism Rate Recidivism Rate 30% 20% With FFT, the odds drop to 59%. Without FFT 10% With FFT 0% 1 2 3 4 5 6 7 8 9 10 11 12 13 14 15 Follow-up Years
$34,549 $11.86 Example: Functional Family Therapy (Washington State - 2010 Dollars) Benefits Per Family Main Source of Benefits Reduced crime $31,745 Lower state & victim costs Increased high school graduation $5,686 Increased earnings Reduced health care costs $307 Lower public costs $37,739 Total Benefits Per Family $3,190 Cost Per Family Net Present Value Benefits Per Dollar of Cost Addendum (distribution of benefits) $3,599= Benefits to participant $8,336= Benefits to taxpayers $21,636= Benefits to others (crime victims)
Results First Technical Assistance • Provide model to state • Train staff in the approach • Provide technical assistance • Help interpret results • Compile and share lessons learned with other participating states • Periodically expand and update model
Interest and Participation in Results First ME WA MT ND MN OR NY WI SD ID MI WY PA VT IA NE OH IN NH NV IL WV UT MA VA CO MO CA KS KY RI NC CT TN OK SC NJ AR AZ NM GA DE AL MS MD LA TX FL AK AK Results First state HI
Results First State Examples • Iowa • Public Safety Advisory Board and Department of Corrections • Iowa Results First: Return on Investment for Corrections Programs – 2012 (May 2012) • New Mexico • Legislative Finance Committee, Department of Corrections, and NM Sentencing Commission staff • Reducing Recidivism, Cutting Costs and Improving Public Safety in the Incarceration and Supervision of Adult Offenders (June 2012)
Informing Policy • Iowa • DOC budget request • Modeling mandatory minimum sentencing changes for drug offenses • New Mexico • Identifying gaps in reporting for community-based programs • Identifying programs that should receive priority funding
Big picture take-aways Research shows that programs can reduce crime and victimization while reducing future spending CBA can provide a framework to compare across policy choices and improve public safety Results First can assist your state with developing CBA expertise
For more information Connecticut Florida Idaho Illinois Iowa Kansas Massachusetts New Mexico New York Oregon Texas Vermont Mike Wilson Technical Consultant, Results First michaelkeithwilson@hotmail.com Ashleigh Holand Senior Associate, Results First (202) 540-6789 aholand@pewtrusts.org