Download
1 / 35
350 likes | 453 Vues
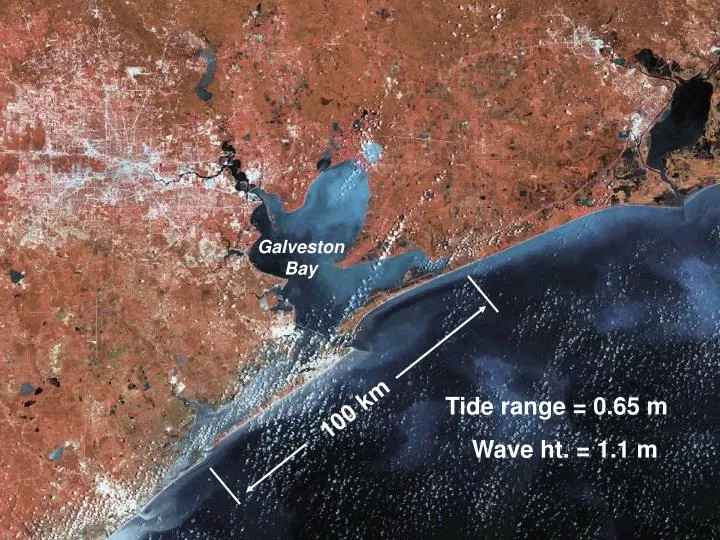
100 km. Galveston Bay. Tide range = 0.65 m Wave ht. = 1.1 m. 1961 – post Carla Jamaica Beach Galveston Isl. 2002 Jamaica Beach Galveston Isl. Coastal Studies Group. Threshold Conditions for Episodic Beach Erosion along the Southeast Texas Coast.

E N D
100 km Galveston Bay Tide range = 0.65 m Wave ht. = 1.1 m
1961 – post Carla Jamaica Beach Galveston Isl.
2002 Jamaica Beach Galveston Isl.
Coastal Studies Group Threshold Conditions for Episodic Beach Erosion along the Southeast Texas Coast James C. Gibeaut, Roberto Gutierrez, and Tiffany L. Hepner Bureau of Economic Geology John A. and Katherine G. Jackson School of Geosciences The University of Texas at Austin
1998 Post Tropical Storm Fay Surfside, Texas
Rollover Pass Beach Nourishment June 1997
1997 Nov Gulf of Mexico Rollover Pass 1998 Pre- Frances 1998 Post- Frances 2000 May geotube 2001 July geotube Lidar Topographic Images Gilchrist East Geotube Area 1,000 ft QAd496
Galveston Island State Park, Pre-Frances, August 8, 1998, (profile BEG-02)
Galveston Island State Park, Post-Frances, September 16, 1998, (profile BEG-02)
Galveston Island, Pre-Frances, August 8, 1998, (profile GLO-04)
Galveston Island, Post-Frances, September 16, 1998, (profile GLO-04)
Shoreline Change Caused by TS Frances Measured by Topographic Lidar
Water Level Standard Deviation (Sigma) • Tide gauge records water level once a second for 180 seconds • These levels are averaged and standard deviation (sigma) computed • Levels greater than 3 x sigma from the average are discarded and new average is determined, which is the reported water level • Sigma is directly related to wave height and is a parameter that indicates the amount of wave energy arriving at the gauge
Extreme Area EA= 12.7 m2,hr Tropical Storm Josephine 1996
Extreme Area EA= 36 m2,hr Tropical Storm Frances 1998
3 2 1 0 Sigma (m) Water level Relative to station datum (m) 0.5 0.4 0.3 0.2 0.1 0.0 1992 1993 1994 1995 1996 1997 1998 1999 2000 2001 2002 1992 1993 1994 1995 1996 1997 1998 1999 2000 2001 2002 1.2 0.8 0.4 0.0 Water level times sigma (m2) TS Lili TS Frances TS Fay TS Josephine HU Opal TS Arlene TS Charley TS Isadore TS Dean TS Allison 1992 1993 1994 1995 1996 1997 1998 1999 2000 2001 2002
Conclusions • The threshold condition for episodic beach/dune/bluff erosion is an EA of greater than 12.This approximates to water levels that exceed 1 m above sea level with coincident wave heights exceeding 2.5 m for more than 24 hrs. • These conditions can occur during distally tracking tropical storms. For example, TS Josephine was 500 km south of Galveston Bay when peak wave heights and water levels occurred.
Conclusions • TS Frances (3-times “stronger” than threshold conditions) did not erode and washover dunes that were more than 3-m above the berm tops or where the dune system was more than about 40-m wide. These areas are also where long-term shoreline retreat rates are relatively low. • Real-time data from the open-coast tide gauge could be monitored to give an indication of damage to expect. Officials should also be aware of the present condition of the beach and structures to anticipate the effects of the next storm.