1 / 1

Race and Ethnic Composition for United States, 1999 and 2025

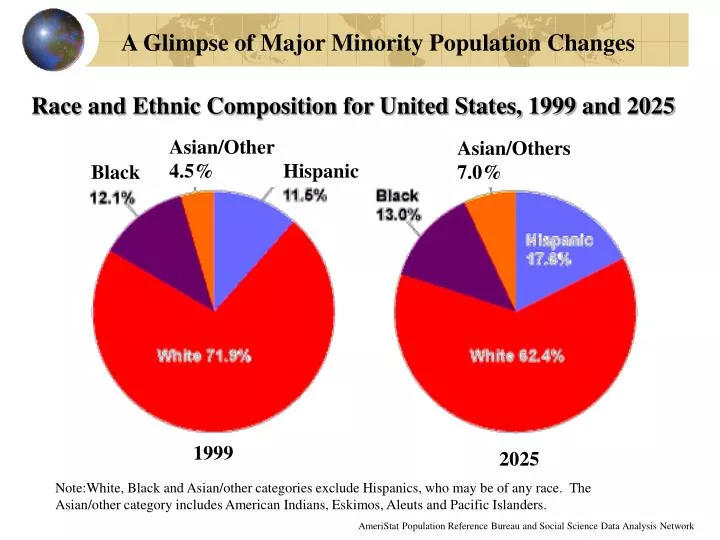
A Glimpse of Major Minority Population Changes. Race and Ethnic Composition for United States, 1999 and 2025. Asian/Other4.5%. Asian/Others7.0%. Hispanic. Black. 1999. 2025.

Télécharger la présentation

Race and Ethnic Composition for United States, 1999 and 2025

An Image/Link below is provided (as is) to download presentation Download Policy: Content on the Website is provided to you AS IS for your information and personal use and may not be sold / licensed / shared on other websites without getting consent from its author. Content is provided to you AS IS for your information and personal use only. Download presentation by click this link. While downloading, if for some reason you are not able to download a presentation, the publisher may have deleted the file from their server. During download, if you can't get a presentation, the file might be deleted by the publisher.

E N D

Presentation Transcript


  1. A Glimpse of Major Minority Population Changes Race and Ethnic Composition for United States, 1999 and 2025 Asian/Other4.5% Asian/Others7.0% Hispanic Black 1999 2025 Note:White, Black and Asian/other categories exclude Hispanics, who may be of any race. The Asian/other category includes American Indians, Eskimos, Aleuts and Pacific Islanders. AmeriStat Population Reference Bureau and Social Science Data Analysis Network

More Related