Download
1 / 17
170 likes | 433 Vues
Coastal Structures 2007, Venice Lykke Andersen, T., Aalborg University, Denmark Burcharth, H. F., Aalborg University, Denmark Gironella, X., UPC, Barcelona, Spain. Single wave overtopping volumes and their travel distance. Introduction.

E N D
Coastal Structures 2007, Venice Lykke Andersen, T., Aalborg University, Denmark Burcharth, H. F., Aalborg University, Denmark Gironella, X., UPC, Barcelona, Spain Single wave overtopping volumes and their travel distance
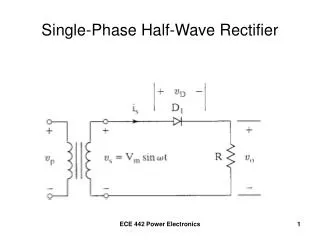
Introduction • The critical overtopping is typically given as an average discharge and not as single wave overtopping volume and velocity, which are expected to be more directly associated to hazards. • The landward distribution of overtopping in combination with the single wave overtopping volume can be used to give an idea of the damage/forces exerted on a structure. • The landward distance the overtopping water travel put restrictions to the use of these areas and their drainage.
Methodology • Methodology for single wave overtopping estimations: • Estimate mean overtopping discharge (e.g. CLASH Neural Network or conventional overtopping formulae) • Estimate number of overtopping waves • Estimate maximum single wave overtopping volume (use results from 1 and 2) • Estimate travel distance of maximum single wave overtopping volume • The present work deals with step 2, 3 and 4 for rubble mound breakwaters.
Experimental set-up (main tests)Lykke Andersen, 2006 (PhD thesis - includes both large and small scale data) • Chambers more narrow at the bottom for good accuracy also for small overtopping discharges. • Chambers equipped with surface elevation gauges and pumps configured to start and stop automatically during tests. • Wave steepness s0p: 0.02 – 0.045
Experimental set-up (additional tests) Burcharth et. al, 2007 (Puerto de la Cruiz, small scale tests) Long waves (s0p = 0.01)
Data analysis • Controlling of pumps in overtopping chambersfrom data acquisition software (e.g. WaveLab2 software package from Aalborg University). • Select water levelsforstart and stop of each pump. • Measure levels in chambers and state of pumps.
Methodology • Methodology for single wave overtopping estimations: • Estimate mean overtopping discharge (e.g. CLASH Neural Networkor conventional overtopping formulae) • Estimate number of overtopping waves • Estimate maximum single wave overtopping volume (use results from 1 and 2) • Estimate travel distance of maximum single wave overtopping volume
Number of overtopping wavesFormula by Van der Meer & Janssen (1995) Non-breaking waves: • f = 0.4 used • Armour crest freeboard used (Ac) for all four cross-sections Burchart et. al, 2007 (f = 0.55) Gives in most cases values in the correct order of magnitude. Large difference between the two data sets.
Number of overtopping wavesFormula by Besley (1999) Number of overtopping waves related to the dimensionless overtopping discharge: Gives a very good estimate for all tested cases!
Methodology • Methodology for single wave overtopping estimations: • Estimate mean overtopping discharge (e.g. CLASH Neural Networkor conventional overtopping formulae) • Estimate number of overtopping waves • Estimate maximum single wave overtopping volume (use results from 1 and 2) • Estimate travel distance of maximum single wave overtopping volume
Single wave overtopping volume Franco et al. (1994), Van der Meer and Janssen (1995): A = 0.84, B = 0.75 Weibulls plotting position formula is used: Combining the two equations leads to: i = 1 => Similar to the equation used by Franco et al. (1994) and van der Meer and Janssen (1995) except that they used Now instead of Now +1 in the logarithm.
Single wave overtopping volume Upper envelope: A = 1.63, B = 0.75 Lower envelope: A = 0.60, B = 0.75 Central: A = 1.12, B = 0.75 Franco + VdM: A = 0.84, B = 0.75 Large Now: Franco + VdM is close to a central estimate Small Now: Franco + VdM is close to a lower limit (unsafe prediction of Vmax)
Methodology • Methodology for single wave overtopping estimations: • Estimate mean overtopping discharge (e.g. CLASH Neural Networkor conventional overtopping formulae) • Estimate number of overtopping waves • Estimate maximum single wave overtopping volume (use results from 1 and 2) • Estimate travel distance of maximum single wave overtopping volume
Landward distribution of mean dischargeFormula by Lykke Andersen & Burcharth, 2006 Ratio of overtopping passing travel distance x at splash down level hlevel: where is the angle of incidence More than 1000 tests
Landward distribution of max single wave overtopping volume Application of formula for distribution of mean discharge on max single wave overtopping volume. Distribution of large single wave overtopping volumes seems not to be very different from the distribution of the mean discharge
In the EU-CLASH project differences between prototype and small scale overtopping results have been observed. The differences might be due to model effects (e.g. wind) or scale effects. Wind and scale effects are expected to be most pronounced for relatively small overtopping discharges (q < 1 l/sm). The presented formula for landward distribution of overtopping is limited to green water overtopping and cannot predict travel distance of wind carried spray. The influence of scale effects on the landward distribution is expected to be quite small as indicated by the test results in large and small scale. Influence of wind & scale effects
Experimental results on overtopping of individual waves have been analysed. A calculation procedure for calculating single wave overtopping volumes and their travel distance has been presented. The formula by Besley (1999) estimate the number of waves overtopping with great accuracy in all of the tested cases. The existing formula for single wave overtopping volume has been slightly modified to account for cases with few overtopping waves. Upper and lower envelope curves has been given for single wave overtopping volume. The travel distance of maximum single wave overtopping volumes is quite similar to that found for the mean discharge. Conclusions Thank you for your attention!