Download
1 / 13
130 likes | 226 Vues
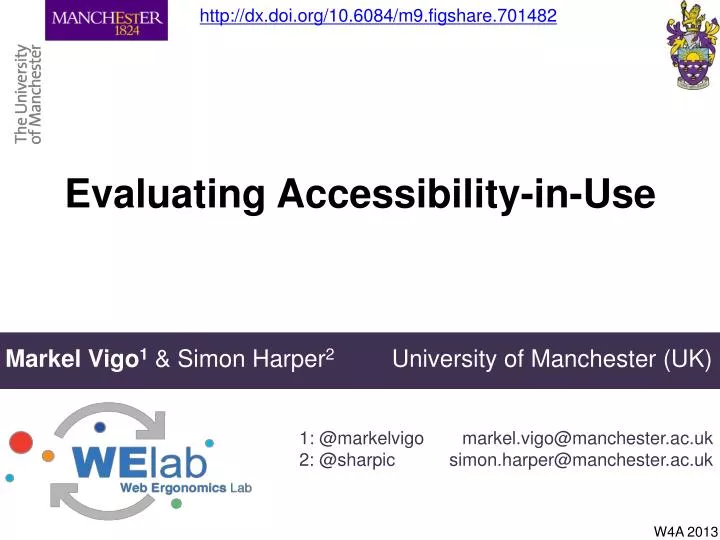
http://dx.doi.org/10.6084/m9.figshare.701482. Evaluating Accessibility-in-Use. Markel Vigo 1 & Simon Harper 2 University of Manchester (UK). 1: @ markelvigo 2: @ sharpic. markel.vigo @manchester.ac.uk simon.harper @ manchester.ac.uk. W4A 2013. Evidence.

E N D
http://dx.doi.org/10.6084/m9.figshare.701482 Evaluating Accessibility-in-Use Markel Vigo1& Simon Harper2 University of Manchester (UK) 1: @markelvigo 2: @sharpic markel.vigo@manchester.ac.uk simon.harper@manchester.ac.uk W4A 2013
Evidence Guidelines cover around 53% of the problems encountered by users Power et al. 2012 Guidelines are only half of the story: accessibility problems encountered by blind users on the web CHI 2012, 433-442 13 May 2013 W4A 2013
Problem The perception of users about accessibility barriers is difficultly measurable and generalisable 13 May 2013 W4A 2013
Paradox • Some barriers are not perceived • Some barriers are encountered but overcome • Barrier free pages can cause a great hindrance 13 May 2013 W4A 2013
Accessibility-in-use “the effects that real accessibility problems have on the quality of interaction as perceived by real users when interacting with real pages for achieving real goals” Vigo and Brajnik, 2011 Automatic web accessibility metrics: where we are and where we can go Interacting with Computers 23 (2), 137-155 13 May 2013 W4A 2013
What do we propose:Step 1. Observation & Identification of Coping Strategies Cognitive markers that indicate problematic situations 1. Observation 6 13 May 2013 W4A 2013
What do we propose:Step 2. Development of algorithms to detect strategies 1. Observation 2. Algorithms 13 May 2013 W4A 2013
What do we propose:Step 3. Deployment in the wild 1. Observation 2. Algorithms 3. Deployment 8 13 May 2013 W4A 2013
Case studyStep 1. Observation and analysis • 2 independent studies/datasets generated from ethnographic studies and user tests • 24 screen reader and screen magnifier users • 17 coping strategies were identified 9 13 May 2013 W4A 2013
Case studyStep 2. Implement algorithms • Asking for assistance • Impulsive clicking • Exploration tactics • Narrowing down search • Gaining orientation • Re-doing • Not operating • Giving up 10 13 May 2013 W4A 2013
WebTactics Case studyStep 3. Deployment: WebTactics 1.1 Detection algorithms are injected onto web pages. tn(){ .. } t1(){ .. } ti(){ .. } 2. When the use of a tactic is detected a notification is triggered. 4. Reports from users are viewed by interested parties. 3. This event is asynchronously sent to a remote location. DB User Website Manager /Researcher 1.2 Each algorithm keeps track of determined sequences of events and actions. 11 13 May 2013 W4A 2013
Contributions • A method to observe accessibility-in-use • Our approach allows to capture the problems that emerge in the wild • WebTactics 13 May 2013 W4A 2013
Follow up Contact @markelvigo | markel.vigo@manchester.ac.uk Presentation DOI http://dx.doi.org/10.6084/m9.figshare.701482 Source code https://bitbucket.org/mvigo/cope 13 May 2013 W4A 2013