Download
1 / 46
460 likes | 563 Vues
A brief introduction to statistical aspects of the Forest Inventory and Analysis Program of the USDA Forest Service Ronald E. McRoberts Patrick D. Miles Forest Inventory and Analysis North Central Research Station USDA Forest Service. Forest Inventory and Analysis (FIA)

E N D
A brief introduction to statistical aspects of the Forest Inventory and Analysis Program of the USDA Forest Service Ronald E. McRoberts Patrick D. Miles Forest Inventory and Analysis North Central Research Station USDA Forest Service
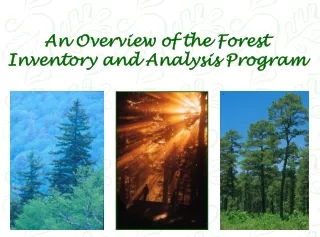
Forest Inventory and Analysis (FIA) Mission: To conduct forest inventories of the United States to estimate: the extent (area) of forest land the volume, growth, and removal of forest resources the health and condition of the forest
Forest Inventory and Analysis Regions Rocky Mountain Research Station North Central Research Station Pacific Northwest Research Station Northeastern Research Station Southern Research Station
Strategic features •A standard set of variables with consistent meanings and measurements • Field inventories of all forested lands • A national sampling design and plot configuration • A systematic, annual sample of each state • A national database with user friendly access
FIA: A 3-phase program Phase 1: Entails use of remotely sensed data to obtain initial plot land cover observations and to stratify land areas with the objective of increasing precision Phase 2: Entails field crew visits to locations of plots with accessible forest to measure traditional suite of mensurational variables Phase 3: Entails field crew measurements of an additional suite of variables related to the health of the forest on a 1:16 proportion of Phase 2 plots
Genesis of the FIA sampling design With thanks to: Tony Olsen US EPA
FIA Phase 2 observed variables • Plot/subplot identification and location • Observed condition (within subplots) - land cover, ownership, forest type, stand age, size class, productivity class - origin, slope, aspect, physiographic class, disturbance • Observed tree attributes - location - species, status, lean, diameter, height, crown ratio, crown class, damage, decay
FIA Phase 2 calculated variables • Tree attributes - volume • Subplot attributes per unit area - number of trees, volume, biomass • By category - species/species groups - status: live, mortality, etc
Using a forest/non-forest map as a means of stratification Number Relative efficiency of strata IN IA MN MO 1 1.00 1.00 1.00 1.00 2 2.00 1.68 2.82 2.33 4 3.94 1.89 3.22 2.89
Forest Health Monitoring (FHM) -Detection monitoring through aerial and ground surveys - Evaluation monitoring for particular situations - Research on monitoring techniques - Intensive site ecosystem monitoring.
FHM Ground Detection Monitoring • Fully integrated as Phase 3 of the FIA program • Indicators monitored: - tree crown condition - tree damage - ozone injury to vegetation - lichen diversity - vegetation diversity - soil chemistry and erosion - coarse woody debris
Spatial output products National attribute maps Ownership maps Map-based estimation - confidential plot location - proprietary information
Small area mapping and map-based estimation • Users want estimates at spatial scales for which FIA does not report estimates • Users want to use FIA data to train satellite image classifiers or as accuracy assessment data • Requires access to plot data and locations • Plot locations are confidential - protect integrity of sample - deter owner access denials - protect proprietary information
Small area mapping and map-based estimation 30 km 30 km Volume Proportion forest
Radius Plots Design-based Model-based (km) Mean SE Mean SE t* Volume 3 1 1032.2 ------- 916.7 162.2 ----- 6 6 1026.6 405.0 886.1 80.5 0.35 9 10 871.6 281.7 841.6 54.1 0.01 12 16 899.4 286.5 833.2 39.7 0.23 15 25 807.6 210.4 843.6 30.5 -0.17 Proportion forest area 3 1 1.000 ------- 0.775 0.055 ----- 6 6 0.833 0.164 0.730 0.025 0.63 9 10 0.700 0.153 0.649 0.015 0.33 12 16 0.625 0.125 0.632 0.011 -0.04 15 25 0.600 0.100 0.648 0.009 -0.48
Fuel Treatment Evaluator Forest Inventory Mapmaker FIA Growth models SpaRRS – Spatial Resource Support System
Forest Inventory Mapmaker
Geographic options County retrievals → Circular retrievals → Polygon retrievals →
Generate tables, maps and data Figure 1. Private timberland as a proportion of all land.
Fuel Treatment Evaluator • Applies thinning prescription to each plot • Estimates torching and crowning index for each plot before and after treatment • Estimates revenues for each plot by tree component • Estimates harvest costs for each plot
Map results of silvicultural prescription Initial biomass Removed biomass Remaining biomass
Focus of support: • assembly of relevant digital data layers • analyses based on the integration of spatial data • comparison of results from different integration approaches • comparison of results from different decision alternatives.
Objective: Identify forested areas of the USA that satisfy three criteria: • high wildfire risk • close to rural communities • in need of economic assistance
Removable biomass - upper 50th percentile
Upper 50% removable biomass Condition classes 2 and 3 < 25 miles to rural community Lower two economic classes
Outstanding statistical issues: Sampling frame and variance estimation Modeling issues - model-based estimation - propagation of error - regional variations Combining data from multiple panels Plots, subplots, and microplots Non-sampled areas - Western Texas and Oklahoma - Piñon-Juniper area (what is a tree?) - Interior Alaska
Technical statistical issues Stratification schemes - plots that sample multiple strata - squeezing more precision from stratifications • The effects of measurement error Map accuracy assessment Modeling issues - design-based versus model-based estimation - propagation of error - regional variants
Summary Forest Inventory and Analysis U. S. Forest Service • Nationally consistent inventory • Emphasis on spatial products • Resource support tools - Mapmaker: data access - Fuel Treatment Evaluator - Spatial Resource Support System • Statistical issues
8 FIA sessions at MSTS* Wed am Forest inventory and monitoring policy am Remote sensing applications pm Statistical applications pm Assessing forest sustainability Thu am Diversity, change, and stability am Approaches to forest health monitoring pm Forest health criteria and indicators pm Carbon accounting applications * FIA scientists will also be speaking in non-FIA sessions
Remember ………….. ………….. only YOU can prevent forest fires!