Download
1 / 12
120 likes | 133 Vues
This study examines the risks of breast cancer recurrence after discontinuing endocrine therapy at 5 years. It analyzes data from 88 trials and provides insights on tumor size, nodal status, tumor grade, and age at diagnosis.

E N D
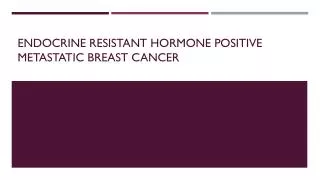
20-Year Risks of Breast-Cancer Recurrence after Stopping Endocrine Therapy at 5 Years The Early Breast Cancer Trialists’ Collaborative Group (EBCTCG) N Engl J Med 2017; 377:1836-46
Selection of Women with Breast Cancer from 88 Trials of Adjuvant Breast-Cancer Therapy ER+, 5 years endocrine therapy (ET) completed: n=63,000
52 N4-9 50 45 40 36 31 N1-3 30 Distant recurrence, % 25 22 22 N0 19 20 10 16 10 11 6 0 ET for 5 years years 0 5 10 15 20 No. at risk (and, in each 5-year period, no. of events and annual rate) N4-9 12333 (2568, 4.8%) 8116 (969, 4.0%) 2165 (121, 3.1%) 259 (13, 2.2%) 52 N1-3 31936 (3126, 2.2%) 23576 (1421, 1.9%) 7250 (241, 1.7%) 949 (39, 1.8%) 183 N0 29925 (1646, 1.2%) 24081 (835, 1.1%) 8571 (272, 1.3%) 1982 (68, 1.4%) 414 Nodal Status and Distant Recurrence, Years 0 to 20
50 49 N4-9 40 40 29 30 28 N1-3 Breast cancer mortality, % 21 20 14 15 N0 12 10 12 5 8 3 0 ET for 5 years years 0 5 10 15 20 No. at risk (and, in each 5-year period, no. of events and annual rate) N4-9 12333 (1463, 2.6%) 9079 (1154, 4.1%) 2481 (185, 3.7%) 294 (20, 2.3%) 57 N1-3 31936 (1600, 1.1%) 24866 (1506, 1.9%) 7728 (319, 1.9%) 1011 (52, 1.8%) 197 N0 29925 (826, 0.6%) 24819 (890, 1.0%) 8926 (228, 0.8%) 2144 (77, 1.0%) 476 Nodal Status and Breast Cancer Death, Years 0 to 20
45 34 T1N4-9 30 25 Distant recurrence, % 20 T1N1-3 15 14 15 13 T1N0 7 8 ET for 5 years 4 0 years 0 5 10 15 20 No. at risk (and, in each 5-year period, no. of events and annual rate) T1N4-9 3832 (391, 3.2%) 1193 (68, 2.6%) 214 (11, 2.2%) 32 T1N1-3 14342 (734, 1.5%) 5138 (162, 1.5%) 817 (35, 1.7%) 154 T1N0 19402 (509, 0.8%) 8020 (218, 1.0%) 2345 (58, 1.0%) 440 Nodal Status and Distant Recurrence, Years 5 to 20 T1 disease
45 41 T2N4-9 31 30 26 T2N1-3 20 Distant recurrence, % 19 19 T2N0 15 11 14 7 ET for 5 years 0 years 0 5 10 15 20 No. at risk (and, in each 5-year period, no. of events and annual rate) T2N4-9 4952 (688, 4.5%) 1517 (106, 3.3%) 285 (12, 1.7%) 51 T2N1-3 10950 (842, 2.4%) 3551 (134, 1.8%) 614 (28, 1.9%) 114 T2N0 9445 (512, 1.6%) 3901 (152, 1.4%) 1129 (37, 1.3%) 218 Nodal Status and Distant Recurrence, Years 5 to 20 T2 disease
30 20 Distant recurrence, % 14 T1cN0 10 T1a/bN0 9 10 4 7 ET for 5 years 3 0 years 0 5 10 15 20 No. at risk (and, in each 5-year period, no. of events and annual rate) T1cN0 13875 (413, 0.8%) 5967 (171, 1.1%) 1641 (46, 1.2%) 309 T1a/bN0 5527 (96, 0.5%) 2053 (47, 0.8%) 704 (12, 0.7%) 131 Tumor Diameter and Distant Recurrence, Years 5 to 20 Rate ratio (T1a/bN0 vs. T1cN0), 0.67 (95% CI, 0.56–0.80) P<0.001 10% risk, yrs. 5-20
30 21 T1cN0 20 19 T1a/bN0 14 Any breast cancer event, % 13 10 7 6 ET for 5 years 0 years 0 5 10 15 20 No. at risk (and, in each 5-year period, no. of events and annual rate) T1cN0 13875 (700, 1.4%) 5832 (264, 1.7%) 1569 (62, 1.7%) 294 T1a/bN0 5527 (210, 1.2%) 2002 (86, 1.5%) 659 (22, 1.4%) 119 Tumor Diameter and Any Breast-Cancer Event, Years 5 to 20 Rate ratio (T1a/bN0 vs. T1cN0), 0.85 (95% CI, 0.75–0.96) P=0.01
30 20 17 High Distant recurrence, % 13 Mod. 11 10 Low grade 10 8 5 6 4 ET for 5 years 2 0 years 0 5 10 15 20 No. at risk (and, in each 5-year period, no. of events and annual rate) High 3054 (92, 0.9%) 1010 (32, 1.3%) 188 (6, 2.6%) 2 Mod. 7363 (186, 0.7%) 2761 (60, 1.0%) 474 (6, 1.1%) 6 Low grade 3524 (49, 0.4%) 1258 (23, 0.8%) 239 (2, 0.6%) 6 Tumor Grade and Distant Recurrence, Years 5 to 20 Rate ratio (low vs. high grade), 0.50 (95% CI, 0.37–0.67) P<0.001 10% risk, yrs. 5-20
30 26 High 22 Mod. 20 17 17 Low grade 15 Any breast cancer event, % 12 10 8 6 5 ET for 5 years 0 years 0 5 10 15 20 No. at risk (and, in each 5-year period, no. of events and annual rate) High 3054 (158, 1.6%) 987 (49, 2.1%) 174 (6, 3.0%) 0 Mod. 7363 (337, 1.3%) 2693 (108, 1.8%) 449 (11, 2.1%) 6 Low grade 3524 (136, 1.1%) 1224 (36, 1.4%) 227 (4, 1.4%) 6 Tumor Grade and Any Breast-Cancer Event, Years 5 to 20 Rate ratio (low vs. high grade), 0.67 (95% CI, 0.54–0.82) P<0.001
Years 0-5 (on endocrine, 74,194 women) Years 5-20 (off endocrine, 62,923 women) Events Women RR (95% CI) Events Women RR (95% CI) Tumor diameter and no. of nodes (TN status) T1N0 (1-20 mm) 0.44 (0.41-0.48) 0.56 (0.51-0.61) 744 19682 785 19402 T2N0 (21-50 mm) 1.00 (0.92-1.09) 1.00 (0.91-1.10) 902 10243 701 9445 0.89 (0.84-0.94) 1.26 (1.18-1.34) T1N1-3 1203 17171 931 14342 1.74 (1.66-1.82) 1.85 (1.74-1.97) T2N1-3 1923 14765 1004 10950 2.20 (2.05-2.36) 2.45 (2.23-2.69) T1N4-9 818 5033 470 3832 T2N4-9 1750 7300 806 4952 3.46 (3.28-3.64) 3.32 (3.09-3.57) Analyses given TN status: Age at diagnosis (years) 2.18 (1.96-2.43) 1.51 (1.26-1.83) <35 338 1585 114 1009 1.22 (1.15-1.29) 1.00 (0.92-1.09) 35-44 1288 10344 623 7859 0.88 (0.84-0.92) 0.86 (0.81-0.91) 45-54 2017 22568 1267 19326 0.97 (0.93-1.02) 1.04 (0.99-1.09) 55-64 2430 25439 1736 22337 0.95 (0.89-1.01) 1.12 (1.04-1.20) 65-74 1267 14258 957 12392 Tumor grade (differentiation) Low (well diff.) 0.45 (0.41-0.50) 0.72 (0.65-0.80) 337 8913 352 8023 0.86 (0.83-0.90) 1.03 (0.98-1.08) Moderate 2434 29158 1575 23490 High 1.52 (1.46-1.58) 1.12 (1.05-1.20) 2617 17137 863 12077 Unknown grade 1952 18986 1907 19333 Ki-67 status 0.60 (0.50-0.71) 0.86 (0.72-1.03) 0-9% 143 3166 129 2796 0.90 (0.79-1.02) 0.96 (0.82-1.12) 10-19% 236 3379 167 2824 1.56 (1.40-1.74) 1.24 (1.05-1.46) ?20% 391 2919 168 2072 Unknown 6570 64730 4233 55231 Progesterone receptor status ER+, PgR–poor 1.42 (1.35-1.49) 1.07 (0.99-1.15) 1600 11733 677 8875 ER+, PgR+ 0.91 (0.89-0.94) 0.99 (0.95-1.03) 4923 56608 2973 45240 PgR unknown 817 5853 1047 8808 HER2 over-expression (trials without trastuzumab) HER2-negative 0.90 (0.84-0.95) 1.02 (0.94-1.10) 1195 17448 734 13262 HER2-positive 1.57 (1.42-1.73) 0.87 (0.71-1.06) 392 3200 102 2156 HER2 unknown 4205 39167 3352 38215 0.5 1 2 4 0.5 1 2 4 Associations of various factors with rate ratio of distant recurrence (RR) during the 5 years of endocrine therapy and after it After 5-yr ET, only TN status matters much
After 5 years of endocrine therapy: • Recurrences continue steadily, years 5-20 • Even low-grade T1N0 disease has 10% risk of distant recurrence in years 5-20 • Risk increases with grade and TN status