Download
1 / 14
140 likes | 155 Vues
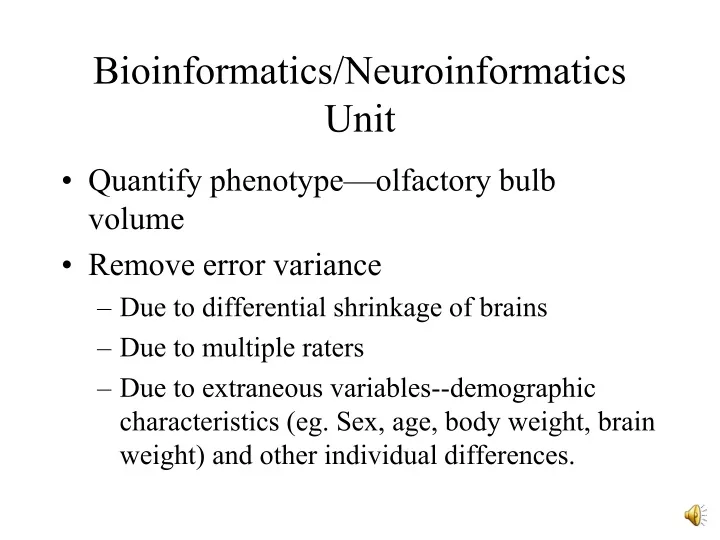
Bioinformatics/Neuroinformatics Unit. Quantify phenotype—olfactory bulb volume Remove error variance Due to differential shrinkage of brains Due to multiple raters

E N D
Bioinformatics/Neuroinformatics Unit • Quantify phenotype—olfactory bulb volume • Remove error variance • Due to differential shrinkage of brains • Due to multiple raters • Due to extraneous variables--demographic characteristics (eg. Sex, age, body weight, brain weight) and other individual differences.
Bioinformatics/Neuroinformatics Unit • Link remaining variance to chromosomal markers—define region of interest on a chromosome(s) • Determine genes at these markers • Determine at least one gene that is either highly expressed or quite down-regulated • In-depth examination of gene
Fig. 2. Genotypes at a microsatellite locus on chromosome 5 (D5Mit294). The left lane is a DNA size standard, and the next two lanes are PCR samples from the parental strains B (higher band at 198 bp) and D (lowest band at 176 bp). Lanes 4 to 25 are the F2 samples. The bottom band—or bands, in the case of heterozygotes—define the genotype of each animal. The bands at the top of the figure are caused by DNA retained in the pipetting wells. Figure from work by G. Zhou (Zhou & Williams, 1997; see Detailed PCR protocols for mapping microsatellites.) The heterozygosity that appears in the first F2 generation will disappear
QTL is good for detecting the approximate locus of multiple genes affecting a phenotype across all the chromosomes, except Y. This is a graph that displays the likelihood ratio statistic as a function of locus on the various chromosomes, which are numbered at top.
I started with the phenotype, and so shall you. Your phenotype will be olfactory bulb size. (I’ll be back--but for now, I have to take a pea.)
Now that the phenotype has been quantified, we need to clean up these data! First of all, who shrank the brains?
The mouse brain library shrunk the brain--they embedded them before they were cut. Tissue Processing: Tissue was embedded in celloidin (Parlodion, Fisher Scientific, P35-100, $497.43/100 g) by Dr. Glenn Rosen and colleagues at Beth Israel Deaconess Medical Center (BIDMC). Upon arrival at BIDMC, brains are placed in fresh 10% formalin for two weeks before embedding. After two weeks, the brains are washed in water for 24 hours before being dehydrated by being placed for 1 day each in a series of 80%, 95%, 100% ethanol and ethanol/ether solutions. The brains are placed into 3% celloidin (in ethanol/ether) for at least a week followed by 12% celloidin for 2–3 days.
OK--so we have to correct for shrinkage in case it is variable among brains, which it is.
We can correct for the shrinkage ifwe know the density of brain (1.05 mg/mm3) because we know how much the brain weighed before processing. We can figure out its original volume, then correct for shrinkage of the olfactory bulbs using this formula:
http://mdcune.psych.ucla.edu/modules/bioinformatics • Go to the above address and download • All Mice v1.0 (Image Library - .zip format) • Download the Image J Program: • Also get zipped PDFs of instructions and spreadsheets