Download
1 / 20
200 likes | 205 Vues
The TEMPO Green Paper: Applications in Air Quality and Health, Agriculture, Forestry, and Economics.

E N D
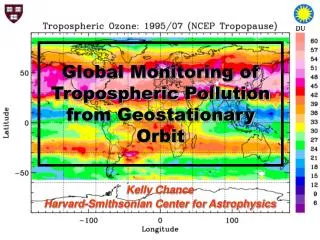
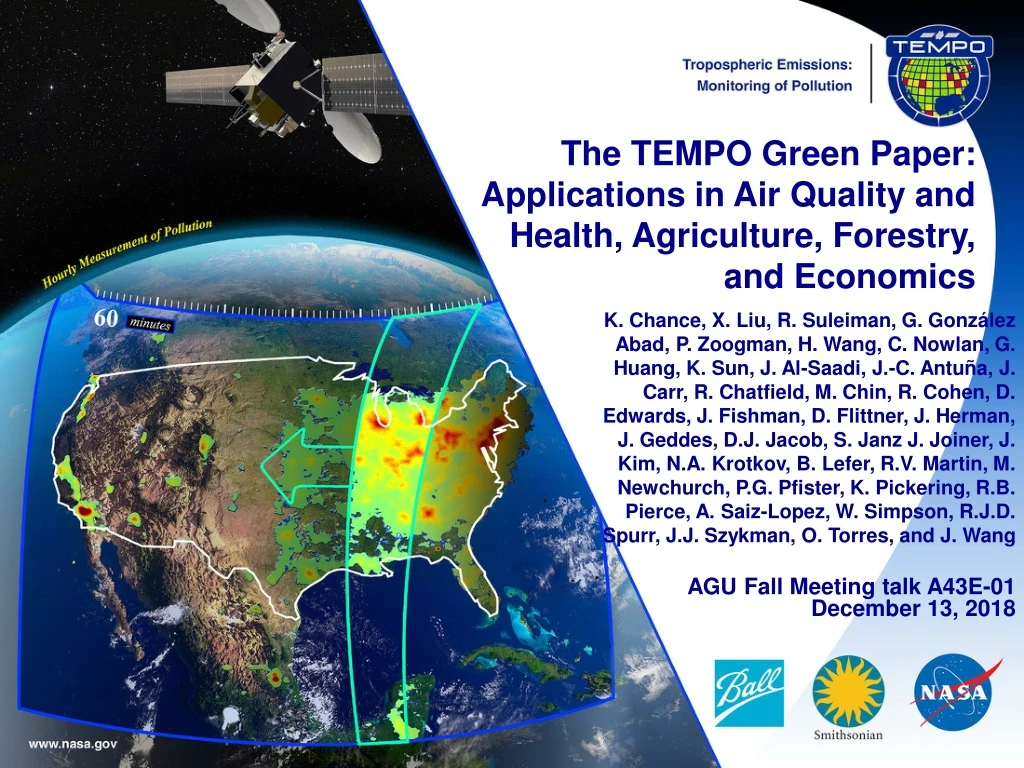
The TEMPO Green Paper: Applications in Air Quality and Health, Agriculture, Forestry, and Economics K. Chance, X. Liu, R. Suleiman, G. González Abad, P. Zoogman, H. Wang, C. Nowlan, G. Huang, K. Sun, J. Al-Saadi, J.-C. Antuña, J. Carr, R. Chatfield, M. Chin, R. Cohen, D. Edwards, J. Fishman, D. Flittner, J. Herman, J. Geddes, D.J. Jacob, S. Janz J. Joiner, J. Kim, N.A. Krotkov, B. Lefer, R.V. Martin, M. Newchurch, P.G. Pfister, K. Pickering, R.B. Pierce, A. Saiz-Lopez, W. Simpson, R.J.D. Spurr, J.J. Szykman, O. Torres, and J. Wang AGU Fall Meeting talk A43E-01 December 13, 2018
Hourly atmospheric pollution from geostationary Earth orbit • PI:Kelly Chance, Smithsonian Astrophysical Observatory • Instrument Development: Ball Aerospace • Project Management: NASA LaRC • Other Institutions: NASA GSFC, NOAA, EPA, NCAR, Harvard, UC Berkeley, St. Louis U, U Alabama Huntsville, U Nebraska, RT Solutions, Carr Astronautics • International collaboration:Mexico, Canada, Cuba, Korea, • ESA, U.K., Spain • Selected Nov. 2012 as NASA’s first Earth Venture Instrument • Instrument delivered • NASA will arrange hosting on commercial geostationary communications satellite with launch expected NET 2020 • Provides hourly daylight observations to capture rapidly varying emissions & chemistry important for air quality • UV/visible grating spectrometer to measure key elements in tropospheric ozone and aerosol pollution • Distinguishes boundary layer from free tropospheric & stratospheric ozone • Aligned with Earth Science Decadal Survey recommendations • Makes many of the GEO-CAPE atmosphere measurements • Responds to the phased implementation recommendation of GEO-CAPE mission design team • North American component of an international constellation for air quality observations
TEMPO status • Instrument completed August 23, now in storage • System Acceptance Review completed • TEMPO is officially delivered • Select commercial geostationary satellite host for launch 2020+ • TEMPO operating longitude and launch date are not known until after host selection
Los Angeles coverage Every hour!
Experimental opportunities • The TEMPO Green Paper living document is at • http://tempo.si.edu/publications. Please feel free to contribute • Up to 25% of observing time can be devoted to non-standard operations: Time resolution higher, E/W spatial coverage less • Two types of studies under regular or non-standard operations • Events (e.g., eruptions, fires, dust storms, etc.) • Experiments (e.g., agriculture, forestry, NOx, ….) • TEMPO team will work with experimenters concerning Image Navigation and Registration (i.e., pointing resolution and accuracy) • Experiments could occur during commissioning phase • Hope to include SO2, aerosol, H2O, and C2H2O2 as operational products • Can initiate a non-standard, pre-loaded scan pattern within several hours • Send your ideas into a TEMPO team member
Research products Volcanic SO2 (column amount and plume altitude is a potential research product. Diurnal out-going shortwave radiation and cloud forcing is a potential research product. Nighttime “city lights” products, which represent anthropogenic activities at the same spatial resolution as air quality products, may be produced twice per day (late evening and early morning) as a research product. Meeting TEMPO measurement requirements for NO2 (visible) implies the sensitivity for city lights products over the CONUS within a 2-hour period at 2×4.5 km2 to 1.1×10⁻⁸ W cm-2 sr-1 μm-1. Several additional first-measurement molecules are being studied. H2O will be produced at launch from the 7νvibrational polyad at 445 nm. Water vapor retrieved from the visible spectrum has good sensitivity to the planetary boundary layer, since the absorption is optically thin, and is available over both the land and ocean. The hourly coverage of TEMPO will greatly improve the knowledge of water vapor’s diurnal cycle and make rapid variations in time readily observed. Atmospheric rivers will be quantitatively tracked.
Traffic,biomass burning Morning and evening higher-frequency scansThe optimized data collection scan pattern during mornings and evenings provides multiple advantages for addressing TEMPO science questions. The increased frequency of scans coincides with peaks in vehicle miles traveled on each coast. Biomass burningThe unexplained variability in ozone production from fires is of particular interest. The suite of NO2, H2CO, C2H2O2, O3, and aerosol measurements from TEMPO is well suited to investigating how the chemical processing of primary fire emissions effects the secondary formation of VOCs and ozone. For particularly important fires it is possible to command special TEMPO observations at even shorter than hourly revisit time, probably as short as 10 minutes.
NOx studies Lightning NOxInterpretation of satellite measurements of tropospheric NO2 and O3, and upper tropospheric HNO3 lead to an overall estimate of 6 ± 2 Tg N y-1 from lightning [Martin et al., 2007]. TEMPO measurements, including tropospheric NO2 and O3, can be made for time periods and longitudinal bands selected to coincide with large thunderstorm activity, including outflow regions, with fairly short notice. Soil NOxJaeglé et al. [2005] estimate 2.5 - 4.5 TgN y-1 are emitted globally from nitrogen-fertilized soils, still highly uncertain. The US a posteriori estimate for 2000 is 0.86 ± 1.7 TgN y-1. For Central America it is 1.5 ± 1.6 TgN y-1. They note an underestimate of NO release by nitrogen-fertilized croplands as well as an underestimate of rain-induced emissions from semiarid soils. TEMPO is able to follow the temporal evolution of emissions from croplands after fertilizer application and from rain-induced emissions from semi-arid soils. Higher than hourly time resolution over selected regions may be accomplished by special observations. Improved constraints on soil NOx emissions may also improve estimated of lightning NOx emissions [Martin et al. 2000].
Halogens BrOwill be produced at launch, assuming stratospheric AMFs. Scientific studies will correct retrievals for tropospheric content. IO was first measured from space by SAO using SCIAMACHY spectra [Saiz-Lopez et al., 2007]. It will be produced as a scientific product, particularly for coastal studies, assuming AMFs appropriate to lower tropospheric loading. The atmospheric chemistry of halogen oxides over the ocean, and in particular in coastal regions, can play important roles in ozone destruction, oxidizing capacity, and dimethylsulfide oxidation to form cloud-condensation nuclei [Saiz-Lopez and von Glasow, 2012]. The budgets and distribution of reactive halogens along the coastal areas of North America are poorly known. Therefore, providing a measure of the budgets and diurnal evolution of coastal halogen oxides is necessary to understand their role in atmospheric photochemistry of coastal regions. Previous ground-based observations have shown enhanced levels (at a few pptv) of halogen oxides over coastal locations with respect to their background concentrations over the remote marine boundary layer [Simpson et al., 2015]. Previous global satellite instruments lacked the sensitivity and spatial resolution to detect the presence of active halogen chemistry over mid-latitude coastal areas. TEMPO observations together with atmospheric models will allow examination of the processes linking ocean halogen emissions and their potential impact on the oxidizing capacity of coastal environments of North America. TEMPO also performs hourly measurements one of the world’s largest salt lakes: the Great Salt Lake in Utah. Measurements over Salt Lake City show the highest concentrations of BrO over the globe. Hourly measurement at a high spatial resolution can improve understanding of BrO production in salt lakes.
Spectral indicators Fluorescence and other spectral indicatorsSolar-induced fluorescence (SIF) from chlorophyll over both land and ocean will be measured. In terrestrial vegetation, chlorophyll fluorescence is emitted at red to far-red wavelengths (~650-800 nm) with two broad peaks near 685 and 740 nm, known as the red and far-red emission features. Oceanic SIF is emitted exclusively in the red feature. SIF measurements have been used for studies of tropical dynamics, primary productivity, the length of carbon uptake period, and drought responses, while ocean measurements have been used to detect red tides and to conduct studies on the physiology, phenology, and productivity of phytoplankton. TEMPO can retrieve both red and far-red SIF by utilizing the property that SIF fills in solar Fraunhofer and atmospheric absorption lines in backscattered spectra normalized by a reference (e.g., the solar spectrum) that does not contain SIF. TEMPO will also be capable of measuring spectral indices developed for estimating foliage pigment contents and concentrations. Spectral approaches for estimating pigment contents apply generally to leaves and not the full canopy. A single spectrally invariant parameter, the Directional Area Scattering Factor (DASF), relates canopy-measured spectral indices to pigment concentrations at the leaf scale. UVB TEMPO measurements of daily UV exposures build upon heritage from OMI and TROPOMI measurements. Hourly cloud measurements from TEMPO allow taking into account diurnal cloud variability, which has not been previously possible. The OMI UV algorithm is based on the TOMS UV algorithm. The specific product is the downward spectral irradiance at the ground (in W m-2 nm-1) and the erythemally weighted irradiance (in W m-2).
Air quality and health TEMPO’s hourly measurements allow better understanding of the complex chemistry and dynamics that drive air quality on short timescales. The density of TEMPO data is ideally suited for data assimilation into chemical models for both air quality forecasting and for better constraints on emissions that lead to air quality exceedances. Planning is underway to combine TEMPO with regional air quality models to improve EPA air quality indices and to directly supply the public with near real time pollution reports and forecasts through website and mobile applications.As a case study, an OSSE for the Intermountain West was performed to explore the potential of geostationary ozone measurements from TEMPO to improve monitoring of ozone exceedances and the role of background ozone in causing these exceedances (Zoogman et al. 2014).
Clouds and aerosols CloudsThe launch cloud algorithm is be based on the rotational Raman scattering (RRS) cloud algorithm that was developed for OMI by GSFC. Retrieved cloud pressures from OMCLDRR are not at the geometrical center of the cloud, but rather at the optical centroid pressure (OCP) of the cloud. Additionalcloud products are possible using the O2-O2 collision complex and/or the O2 B band. AerosolsTEMPO’s launch algorithm for retrieving aerosols will be based upon the OMI aerosol algorithm that uses the sensitivity of near-UV observations to particle absorption to retrieve Absorbing Aerosol Index (AAI), aerosol optical depth (AOD) and single scattering albedo (SSA). TEMPO may be used together with the advanced baseline imager (ABI) instruments on the NOAA GOES-R and GOES-Ssatellites, particularly the 1.37μm bands, for aerosol retrievals, reducing AOD and fine mode AOD uncertainties from 30% to 10% and from 40% to 20%.
City lightsspectroscopic signatures VIIRS – Day-Night Band (DNB) Laboratory Spectra of Lighting Types (C. Elvidge): http://www.ngdc.noaa.gov/eog/night_sat/spectra.html TEMPO Ultraviolet TEMPO Visible
The end!Thanks to NASA, ESA, Ball Aerospace &Technologies Corp., The Boeing Company
AQ indices • What is an AQ index?” • “The Canadian Air Quality Health Index is a multipollutant index based on the sum of PM2.5, NO2, and O3,weighted by their contribution to mortality in daily time-series • study across Canadian cities.” [Cooper et al., 2012] • Cooper et al., for example, propose a satellite-based multipollutant index using the WHO Air Quality Guidelines (AQG): • Can we define different indices as appropriate to locations, seasons, times? • Might they be formulated using RSIG? • Might assimilation be included? Cooper, M., R.V. Martin, A. van Donkelaar, L. Lamsal, M. Brauer, and J. Brook, A satellite-based multi-pollutant index of global air quality, Env. Sci. and Tech., 46, 8523-8524, 2012.
Coverage comparisons • Spatial resolution: allows tracking pollution at sub-urban scale • GEO at 100°W: 2.1 km N/S × 4.7 km E/W = 9.8 km2 (native) at center of FOR (36.5°N, 100°W) • Full resolution for NO2, HCHO, total O3 products • Co-add 4 N/S pixels for O3 profile product: 8.4 km N/S × 4.7 km E/W ~ 1/300 of GOME-2 ~ 1/30 of OMI
TEMPO footprint (GEO at 100º W) For GEO at 80ºW, pixel size at 36.5ºN, 100ºW is 2.2 km × 5.2 km.