Download
1 / 19
190 likes | 290 Vues
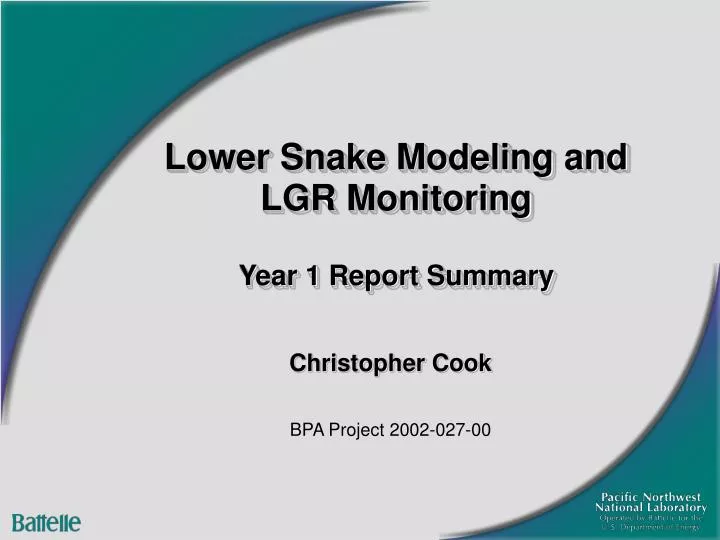
Lower Snake Modeling and LGR Monitoring Year 1 Report Summary. Christopher Cook BPA Project 2002-027-00. Current Geographic Extent: Lower Granite Pool to Columbia R. Note: USACE is reviewing data. 2002 Temperature Monitoring Locations. Pressure sensors at Sites 2, 3, 4, & 7

E N D
Lower Snake Modeling and LGR MonitoringYear 1 Report Summary Christopher Cook BPA Project 2002-027-00
Current Geographic Extent: Lower Granite Pool to Columbia R. 2
Pressure sensors at Sites 2, 3, 4, & 7 Spring/Summer 2002 => pool had little slope 5
Appendix A and provided to USACE Most downstream site. Approximately 9 miles from LGR. Most downstream Clearwater R. site. Attached to railroad trestle. Note: black lines indicate depths of loggers 6
Water velocity (ADCP) measurements: 2 surveys of 52 pts Note: Data provided to USACE 7
LGR Velocity and Thermal Structure • Mode 1: Weak to No Stratification • Mode 2: Strong Stratification Typical mode 1 pattern. Rivers flow parallel to each other at the confluence. Satellite Image 4/4/2002 Temp delta = 1.5° C 8
14 Degree Isotherm 20 18 °C 16 14 18 Degree Isotherm 20 Degree Isotherm 20 18 °C 16 14 20 18 °C 16 14 Typical mode 2 pattern. Clearwater subducts under the Snake River. Satellite Image 7/21/2002 Temp delta = 10° C Density Driven Flow Colder Clearwater R flow can migrate up the Snake R. Migration halts when a balance between momentum and buoyancy is reached. 9
3-D Modeling of LGR Examples of the numerical grid, colored by bathymetry 10
3-D Model => a work in progress • Ongoing model fixes • Calculation error at downstream boundary • Doesn’t impact results at PNNL sites…issues downriver by the dam • As of today, bug (appears) to be fixed and seems to be working properly. • Need to improve water balance. Will apply CE-QUAL-W2 to calculate Q for synthetic tributary. • Temperature difference plots in report • Could be better. • Next steps are to adjust surface heat exchange parameters for an improved fit – need to fix boundary 1st. 12
LGS IHR LMN CE-QUAL-W2 Modeling of the Lower Snake River • Year 1 applied CE-QUAL to LGS, LMN, and IHR • Bathymetry dataset is from MASS1 (0.5 mile dx, 1m dz) • CE-QUAL volumes compared to Water Control Manual • LGS & IHR < 5%; LMN < 10% 13
CE-QUAL-W2 Boundary Conditions • Inflow discharge and temperature data • Upstream data specified hourly • Obtained from USACE database • LMN => Tucannon and Palouse Rivers • Q (daily) from USGS. Temp (hourly) from USACE • Meteorology • All reservoirs used Rice Bar AgriMet data (mid-LGS) • IHR results may be improved by using closer station PAWS station (Fishhook) • Downstream flow boundary • Specified hourly & obtained from USACE database • Distributed tributary used to achieve correct elevation at downstream. Iterative process. Average adjustments were less than ±3% of river Q. 14
Year 2 Data Collection • Temperature Loggers • Same 11 sites as last year • 2 additional: Red Wolf (replace USGS) & US-12 • Installed April 28 – May 1 • Maintenance trips: weeks of June 16, July 21 • Removed week of Sept 22 • ADCP survey • Increased coverage of confluence zone • Survey trips • May 14-16. 15 cross-sections x 3 pts surveyed • Aug 11-13, Aug 25-28 • Increased monitoring of confluence zone • Upstream migration of Clearwater • Satellite and IR Camera monitoring to improve understanding of mixing zone (shape, location, etc.). 18
Year 2 Modeling • CE-QUAL-W2 • Test sensitivity to met conditions • Cloud cover • Fishhook data at IHR • Wind variations (topographic steering issue) • Validate against mid-pool temperature time series • Simulate LGR pool in support of 3-D modeling • 3-D CFD of LGR • Confirm working properly • Adjust parameters for best fit • Validate against Year 2 data 19