Download
1 / 14
140 likes | 210 Vues
Ray Link EVP and CFO Presentation at PSU – May 2008.

E N D
Ray Link EVP and CFO Presentation at PSU – May 2008
This presentation contains forward-looking statements that include our outlook for Q2 2008 and future periods, statements about the outlook and expected growth rates for certain markets, customer spending, prospects for future growth, product revenues, future earnings and profitability, prospects for margin improvement and market acceptance of technology. Factors that could affect these forward-looking statements include, but are not limited to, the strength of the Research and Industry, Electronics and Life Sciences markets; lower than expected customer orders; cancellation of customer orders; increased competition and new product offerings from competitors; failure of the company to introduce products as planned or achieve cost reductions and revenue growth as planned; failure of the company's products and technology, to find acceptance with customers; business conditions and growth in the electronics industry and general economy, both domestic and foreign; failure of restructuring programs to reduce costs as planned; delays or failure in the development of emerging nanotechnology markets, fluctuations in interest and exchange rates and changes in trade policies and tariff regulations. Please also refer to our Form 10-K, Forms 10-Q and other filings with the U.S. Securities and Exchange Commission for additional information on these factors and other factors that could cause actual results to differ materially from the forward-looking statements. Safe Harbor Statement
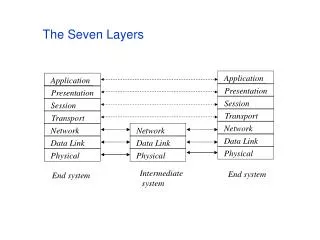
The Leader in Tools for Nanotechnology • Broad product line • Scanning and Transmission Electron Microscopes • Focused Ion Beam Systems • DualBeamsTM – Lab and Fab • Widespread market acceptance • Three major markets – Electronics, Life Science, and Research & Industry • Over 6,800 Systems Installed • Sales & service in 50 countries • Over 3,500 customers worldwide • Established track record • Founded in 1971 – headquarters in Hillsboro, Oregon • Merged with Philips Electron Optics in 1997 • Development & Manufacturing in Oregon, California, The Netherlands, Czech Republic and India • NASDAQ listing – ticker FEIC – market cap ~ $800 million • Revenue ’07 - $592.5m, net income $58.3m, both record highs
Growth and Regional Diversity 26% 33% $M 41% 2007 Bookings = $598.4 Million • CAGR (1998 to 2007) = 14%
Solid annual improvements: 2005-2007 Bookings Up 16% CAGR Revenue Up 16% CAGR Gross Margin Operating Margin
Broad Customer Base Production Development Research
Current Situation – Currency Matters • Revenue has stalled ~ $150m per quarter and profits are down from earlier record highs and stock price is down. • The dollar has declined over 30% vs. the euro in the past two years and even more vs. Czech Koruna. • We manufacture over 90% of our products in Europe and incur about 45% of our total R&D and SG&A in Europe yet only 40% of products are sold in Europe. Thus, we are “short” euros and CZK of around $25m per quarter. • Of our total COGS, purchased components comprise approximately 75% of the total. Of this about 65% (75% excluding third party items) are sourced from Europe.
Imbalance of Revenue and Expenses by Currency • FEI manufactured over 90% of its products in Europe (Acht & Brno) in ’07. • We sell less than 40% of our products in Europe. • We also have a large portion of our R&D and other costs based in Europe. • As a result we have more euro and Czech koruna costs than revenues so we are “short” these currencies.
The Weakness of the Dollar is Starting to Hurt • Over the past 2 years both the euro and Czech koruna have strengthened significantly compared with the dollar. • Over the past 5 quarters FEI’s gross margin has declined, partly from the large decline in the dollar. • Each $.01 movement costs FEI over $200,000 per quarter.
Foreign Currency Exposures FEI Experiences three types of foreign currency exposures: 1. Balance sheet translations of monetary assets and liabilities of foreign subs - gain / loss charged monthly to other income and expense • FEI’s goal is to maintain this between +/- $300,000 per quarter by hedging net monetary asset exposures of subsidiaries. We hedge this with forward contracts. 2. Balance sheet exposures of non-monetary assets and liabilities of subs (net Investment) recorded in “Other Comprehensive Income” (Equity) • FEI does not hedge this exposure – no P&L impact
Foreign Currency Exposures • 3. P&L exposure of mismatch of EUR expenses and USD revenues in Europe • FEI goal to minimize volatility to gross margin of USD/EUR exchange rate swings • Forecasted 12 month exposure = $100 million net of natural hedges • Hedge on a rolling basis: normally 9 – 12 months out • Realized gain or loss flows through cost of goods sold • Unrealized gain or loss (mark to market) flows through OCI • Hedge vehicles = “Zero cost collars” (forward contract) or option contracts • Zero cost collars = provides participation from USD gains while also limiting downside risk of a higher EUR; acts like a forward contract with a band. Considered an “effective hedge” under FAS 133. • Option benefit = provides full participation in USD gains while limiting downside risk of a higher EUR; no trigger level • Option cost = upfront premium which is amortized over the life of the contract. Premium is about 2% of notation value for a 6 month contract.
FAS 133 – hedge accounting • Criteria to achieve “deferral” or “hedge” accounting: • Formal documentation of management’s objectives and strategy for undertaking the hedge • The documentation must include relevant details such as the dates or periods of time to be hedged, the specific nature of the asset or liability and the currency or quantity hedged • At the inception of the hedge and ongoing, the hedging relationship must be highly effective in offsetting cash flows and the hedge relationship must also be highly effective • Effectiveness is measured quarterly • This is a complex task and if hedges are not effective, hedge accounting is disallowed and all contracts are marked to market as a P&L item immediately as a non-operating item. Thus, no benefit to operating expenses in the desired period if hedge accounting not allowed. • Hedging can only smooth out temporary shifts. It cannot deal with a long term decline in the dollar as new hedge contracts are put on at the new current level of the dollar.
What are we doing to deal with this issue? • Restructure operations to increase efficiency, improve capacity utilization and balance currency exposure • Transition supply chain to lower-cost, dollar-based areas • Lower costs and gain a “natural hedge” on currencies • Move product lines to balance capacity • Utilize outsourcing where cost-effective • Reduce product platforms by 40% over 3 years • Lowers costs and simplifies ability to source common parts