Download
1 / 33
330 likes | 449 Vues
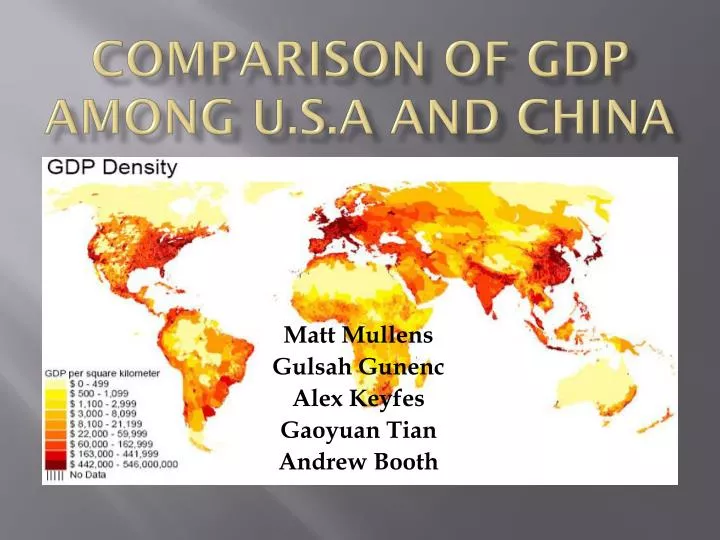
Comparison of GDP among u.s.a and china. Matt Mullens Gulsah Gunenc Alex Keyfes Gaoyuan Tian Andrew Booth. Preview of Coming Attractions (Outline). Motivation Background Data sources Models Model Validations Results Conclusions Questions. Motivation.

E N D
Comparison of GDP among u.s.a and china Matt Mullens Gulsah Gunenc Alex Keyfes Gaoyuan Tian Andrew Booth
Preview of Coming Attractions(Outline) • Motivation • Background • Data sources • Models • Model Validations • Results • Conclusions • Questions
Motivation • We wanted to first off see what a forecast of the United States GDP will be for the rest of the year • Thought it was relevant given current economic state • We also wanted to compare the GDP of two dissimilar countries • Compared USA and China
Background • The US is considered to be a long established industrialized country • China is considered to be an emerging or developing nation • We figured that the US and China models would be different.
Data Source: USA • USA data gathered from: • http://www.bea.gov/national/index.htm#gdp
Data Source: China • Chinese data gathered from: • http://www.stats.gov.cn/eNgliSH/statisticaldata/Quarterlydata/
Models:Main US GDP Model • Quarterly data from 1947 first quarter -2009 first quarter
Models:Main US GDP Model • Pre-Whitening Process • Needed to be logged and first differenced
Models:Main US GDP Model • Model Validation • As seen from the correlogram more work is needed
Models:Main US GDP Model • Final ARMA model
Models:Main US GDP Model • Model Validation
Models:Main US GDP Model • More Model Validation • Actual, Fitted, Residuals
Forecast of US Model • Forecast for the rest of 2009
Forecast of US Model • Recoloring of GDP • Recoloring: • Lngdpf=lngdp (2009:1 2009:1) • lngdpf=lngdpf(-1)+dlngdpf (2009:2 2009:4) • gdpf=exp(lngdpf) (2009:2 2009:4)
Results • Possible Forecast Bias • Long time period upward trend • According to our model it will increase, only time will tell
A Closer Look • Examine just the past few years in an attempt to eliminate upward time trend
Model:US Short Term • Data had linear trend • Needed first difference
Model:US Short Term • Model Validation • Looking at the correlogram more work was needed • Try ARMA model
Model:US Short Term • Final ARMA Model
Model:US Short Term • Model Validation • A much better looking model • High P-values for Q-stats
Forecast (US Short Term) • Forecast of the rest of 2009
Forecast (US Short Term) • Recoloring of the model
Results • A better estimation as the long time upward trend is less of a bias • Due to economic changes over the past decades a data set that includes only more recent data is more accurate for forecasting • More relevant to current economy • Reflects current issues without previous bias
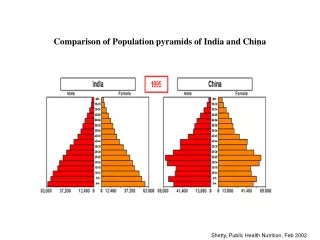
China Model • Looking at the past few years of China’s GDP • Highly seasonal due to large economic dependence on seasonal agriculture of 900 million farmers
China Model • Pre-Whitening • Needed both log and seasonal differencing • Also used from 1998-2008 and first differenced
China Model • Model Validation • Correlogram • Needs some work • Try ARMA model
Model Validation • A much better looking model • High P-values for Q-stats • Appears valid
Forecast (China) • Rest of 2009
Forecast (China) • Recoloring Model
Results • China continues with an increasing seasonal trend • This can be accounted for by the large agriculture economy in China
Conclusions • Not surprising that USA and China did not have similar models • USA historic leading economy • China is a recent world economy • Long term upward trends indicate USA economy will improve • Shorter term model is less generous
Fin • Any Questions? • anyone • Any Comments? • anyone