Download
1 / 15
150 likes | 157 Vues
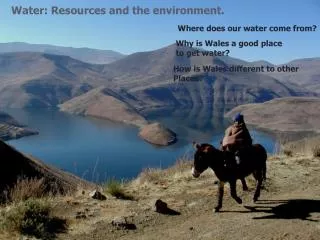
This chapter examines the production and reserves of crude oil, the growth of renewable resources, energy use by different country groups, growth forecasts, the depletion value of important minerals, natural resource prices, the real price of oil, the environmental Kuznets curve, smoke concentration in London, average global temperatures, and the relationship between GDP per capita and carbon dioxide emissions.

E N D
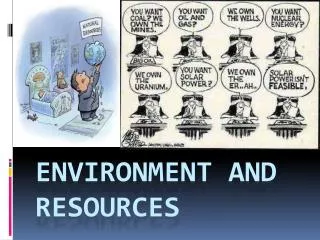
Chapter 16 RESOURCES AND THE ENVIRONMENT AT THE GLOBAL LEVEL
Figure 16.1 World Crude Oil Production, 1900–2010 Sources: Jenkins (1977), p. 85 and Table 2, U.S. Department of Energy, Energy Information Administration (2007), Chapter 11, BP (2011).
Table 16.1 World Crude Oil Production and Reserves (Billions of Barrels)
Figure 16.3 Growth Forecast from The Limits To Growth Source: Meadows et al. (1972), Figure 35.
Table 16.3 Calculation of the Value of Depletion for the 14 Most Important Minerals
Figure 16.4 Natural Resource Prices, 1850–2010 Source: Cashin and McDermott (2002), The Economist industrial commodity price index.
Figure 16.5 Real Price of Oil, 1861–2010 Source: BP (2011).
Figure 16.6 An Environmental Kuznets Curve Source: Shafik (1994).
Figure 16.7 Smoke Concentration in London, 1585–1940 Source: Brimblecomb (1977), Figure 5.
Figure 16.8 Average Global Temperatures Source: www.giss.nasa.gov
Figure 16.9 GDP per Capita versus Carbon Dioxide Emissions per Capita Sources: Heston, Summers, and Aten (2011), http://cdiac.ornl.gov/.
Chapter 16 Appendix: Technological Improvement versus Resource Depletion