Download
1 / 58
580 likes | 588 Vues
Review Basics of Imaging. Instructor: Nikolaos V. Tsekos Instructor E-mail: ntsekos@cs.uh.edu Course E-mail: mrl@cs.uh.edu. WEB SITE: http://www2.cs.uh.edu/~cs6 3 70/. Goal and Contents of this Lecture. Goal: Review the Basic features of imaging that are common to ALL modalities

E N D
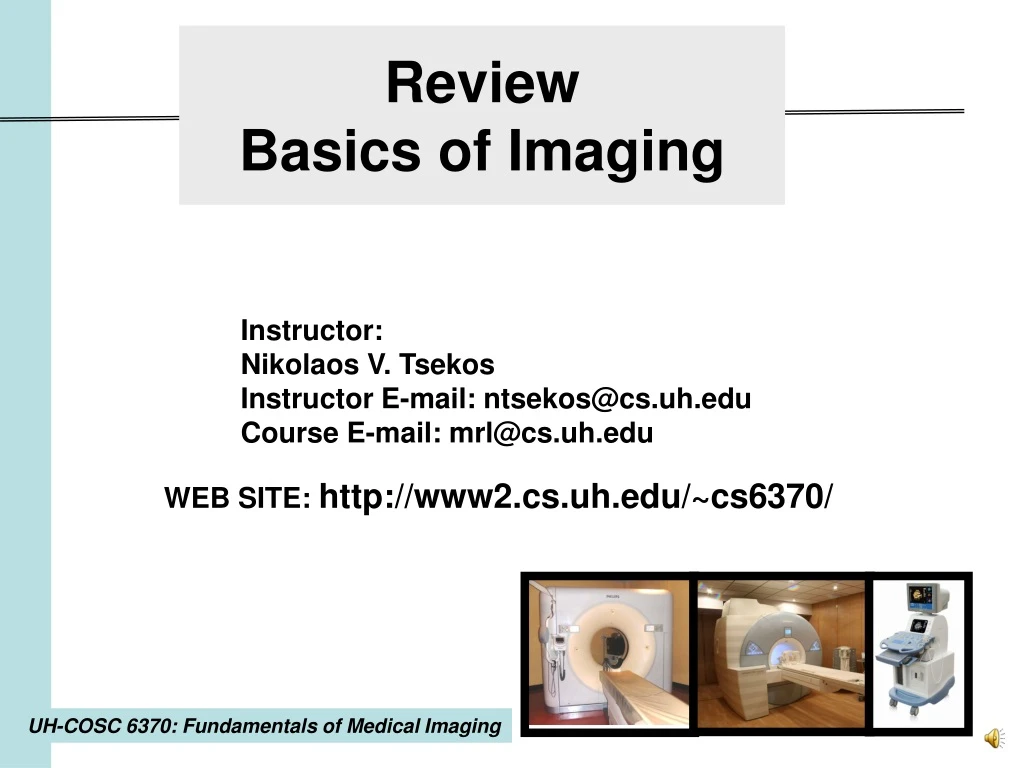
Review Basics of Imaging Instructor: Nikolaos V. Tsekos Instructor E-mail: ntsekos@cs.uh.edu Course E-mail: mrl@cs.uh.edu WEB SITE: http://www2.cs.uh.edu/~cs6370/
Goal and Contents of this Lecture Goal: Review the Basic features of imaging that are common to ALL modalities • Contrast, Noise, SNR, CNR • Slice Thickess and Orientation • In-plane resolution
Why do we do Imaging? The Purpose of medical imaging is to : • Understand how the healthy body operates • Identify and characterize a disease HOW? • From the appearance of the images CONTRAST is the appearance of an image that is used to identify natomy, function and diseased tissue
How Do we Do that From Images? Angiography with MRI Anatomical with MRI (white arrows: tumor) How a structure looks like as compared to: • Neighboring tissue • Healthy tissue IMAGES without Meaningful contrast are USELESS!
Signal Intensity in Imaging: a simplified definition (for now …) • An image is formed from the signal received by a detector (the film, in standard X-rays, or a “digitizing” electronic one that digitizes it, as in MRI, CT or Ultrasound) • In all cases, the brightness of the image relates to the amount of tissue that gives this particular signal. • “Signal Intensity” is the measure of how much signal we received • The more the tissue or species that give rise to this signal, the highest the intensity • The highest the intensity, the highest the brightness of this area in the image
Calculating Contrast SA CA,B = ABS(SA – SB) SB • The contrast is a relative measure of how well one area in an image is differentiated relative to another area! • We can define the contrast of one type of tissue, A, relative to another tissue, B. • If the Signal intensity from the same size areas (red circles) can be measured (SA and SB), then the contrast CA,B can be calculated: B A This the essence of imaging
Contrast Agents! • In certain cases the diseased tissue cannot be seen with “standard” imaging! (i.e. Does not have high contrast relative to the healthy or surrounding tissue) AND/OR • Healthy anatomies cannot be seen very easily! SOLUTION: Add some special chemical that “highlights” a specific disease OR anatomy CONTRAST AGENTS
Contrast Manipulation with Accumulation Before 5 minutes after Subtraction
Expanding the definition of Contrast after before SAfter SBefore • When a contrast agent is used then contrast is defined as signal intensity “after” minus signal intensity “before” CAfter-Before = ABS(SAfter – SBefore)
Adjusting Contrast on the scanner:By adjusting the acquisition parameters Adjust the power or “strength” of x-rays
Adjusting Contrast on the scanner:By adjusting the acquisition parameters Same scanner, same patient, same slice, same exam! Adjust the image to be sensitive to a certain physical entity Left: proton density (PD) Right: Relaxation time T2 Both PD and T2 are properties of tissue and are characteristic of normal or diseased states.
Why we do Imaging • To assess physiology and patho-physiology • Minimally OR Non-invasive • Many complementary Information
Contrast (1) No Agent With Agent • Imaging has value ONLY when it gives us MEANINGFUL Contrast • Contrast is the different between two tissues or anatomies • or Contrast is the difference between a healthy and a diseased tissue • or Contrast is generated by a contrast agent i.e. before, during and after it passes
Contrast (2) For our course: we can change the contrast by: • Adjusting the image acquisition parameters • Infusing contrast agent • Induce some physiologic perturbation
The image and its real counterpart • image contrast relates to the tissue properties (or the presence of contrast agent) • But also, image has “spatial” information: • 2D images: • Orientation • Thickness • In-Plane Resolution
Orientation • Image is a “see through photograph” of a real object • An image relates to the actual object
A 2D image = A slice Through the body • An image is a “cut” through the body; a SLICE • Tomography from Tomi = slice/cut (Anc Gr) • But “how thick is this cut or SLICE”? • and “how do we see this thick cut”?
Slice Thickness (1) pyramid A simple example • Whatever is inside the imaged slice is “compressed” or PROJECTED along the dimension of the slice thickness • Structures superimposed
SLICE THICKNESS Assume a 3D structure, like a blood vessel Y Y bifurcation X Z SIDE View Plane XZ TOP View Plane YX
SLICE THICKNESS: “thick slice” Y Y Z Slice thickness X Image
SLICE THICKNESS: “thick slice” Y Y Slice 1 Z Slice thickness X Image
SLICE THICKNESS: “thick slice” Y Y Slice 2 Z Slice thickness X Image 2
SLICE THICKNESS: “thick slice” Y X Image 2 Image 1
SLICE THICKNESS: Loss of 3D Y Z X X Y Z
SLICE THICKNESS: “thin slices” Y Image 1 Slice 2 Slice 4 Image 2 X Image 4 Slice 1 Slice 3 Image 3
Slice Thickness (2) SIJ SI = ΣSIJ • Superposition means that from a thicker slice we will have more signal!
Slice Thickness (3) cancer Another simple example The Lesion! • Whatever is inside the imaged slice is “compressed” or PROJECTED along the dimension of the slice thickness • Structures superimposed 3 “thin” slices
Thick vs. Thin Slice (e.g. CT) Thick 8 mm slice Thin 1 mm slice http://www.mevis-research.de/~hhj/Lunge/xSammlungAnaFr.html#Heart and vessels
Slice Thickness • A slice “compresses” the tissue along its thickness • Thicker slices correspond to more signal • Thinner slices may offer higher informational content • Any certain modalities slice thickness can be adjusted by the operator thus • Even if an image is 2D, it corresponds to a 3D piece of tissue!!!
Resolution • This is an in-plane property of an image • It is like breaking the tissue in small pieces • Digitized RAW data come out in the form of a matrix (e.g. N x M) • Any imaging modality has an inherent or “true” resolution that relates to the way data are collected • The true resolution cannot be changed with post-processing!
Real world vs. image Matrix: SI (n. m) Slice thickness ? SCANNER Data collection
How this thing happens?Spatial Encoding • The scanner collects the data in a way that there is a known relationship between the a datum of signal and the “piece of tissue” that gives this signal 3D piece of tissue Pixel of the image
So what is a pixel? 0 5 10 0 0 0 5 5 10 The digital representation The image • Is the digital representation of the smallest piece of information • That corresponds to the smallest piece of tissue we can see with this particular modality • Practically is a matrix element with a certain Signla Intensity (SI) value associated with it.
Pixel • We see no more details • A pixel does NOT have any structure; just “brightness” • The only information a pixel offers is a Signal Intensity (SI) • The SI of the pixel is the total amount of signal that originates from all the elemental sources in the elemental piece of tissue Number of elemental sources 1 10 5 0 10 1:1 10:1 5:1 0:1 10:1 Brightness Or SI
Noise !!! Average value • Random variation of the signal intensity (i.e. brightness) • Root-mean-square value
Signal-to-noise Ratio (SNR) • Shows us how strong the signal is relative to the noise • Measure of image quality A Primary goal in imaging is to increase SNR as much as possible!!! Textbook fig. 5.9 p. 228
How do we measure it? RMS (noise) “signal” “signal” • Tissue specific • Any shape ROI! • Must be normalized to size! (or # of pixels) Regions-of-Interest (ROI)
Contrast revisited:Contrast-to-Noise ratio (CNR) Textbook fig. 5.9 p. 228
Field-of-View (FOV) FOV = 50 x 50 cm2 L = 50 cm L = 50 cm L = 50 cm The FOV can be any size and not necessarily rectangular
Is the real world digital? Matrix 6x7 & FOV = 6 x 7 cm2 • NO!!! • So, what is the size (in mm) of the pixel? • Is it correct FOV/matrix size? Well …. Yes! And … NO!!!
Sampling the Real World A 1 D “Real” Object No material No material material X The sampler Is a function that moves along the scanning axis (X) and collects signal that depends on the amount of tissue that gives such signal
How does it work?CONVOLUTION • The sampling function moves in “steps” • In each step it “stops” (e.g. position P) and • “multiplies” itself with the “sample” • This multiplication is unique: it multiplies its entire shape! • OR it “duplicates” itself weighted by the “amount of sample” • The result of this multiplication (a shape) is then placed at the point of sampling
Sampling with a delta function STEP 1: We “split” the sample in “pieces”: by the computer that controls the scanner OR by the internal design of the probe d(x) = 1 X STEP 2: We “move” the “sampler“ in each position and then we multiply it with the “amount of tissue”… this value is then recorded in an array A 1D image ! “array” along X
If our sampling function is infinitesimally thin (“just a line”) then • The result are points with intensity proportional to the amount of tissue • AND the shape of the object remains the same! X
But in reality … • The sampling function is not a delta function BUT: • It has shape and … width! • Assume this sampler • So, when we sample we should “multiply” that shape with our object!