Download

1 / 38
380 likes | 386 Vues
Explore the interface dipole formation, jellium model, surface dipole formation, and the effect of surface structure and steps on work function in electrical properties at surfaces.

E N D
EEW508 V. Electrical Properties at Surfaces Interface: two different bulk materials are brought together to form an interface The abrupt change of electronic structure from one material to another induces the structural rearrangement of nuclei and electrons in the interface region in order to reduce the total energy of the system. The overall result is forming an interface dipole. Roughness reduces the interface dipole Adsorption of atoms or molecules perturbs the electronic structure, thus the interface dipole.
EEW508 V. Electrical Properties at Surfaces Jellium model If we consider atomically-smooth slab of solid in UHV. The ion cores of atoms can be viewed as being smeared out to produce a uniform density of positive charge. Electrons are bound to this uniform charge by electrostatic forces. In jellium model, the Fermi energy, the energy of the highest occupied state by conduction electrons Where, is the average conduction electron density in the bulk, EF and n are in the unit of eV and nm-3 Then, EF= 36.46 x 10 –2 n 2/3 rs = (3/4 n)-1/3 , that is the radius of a sphere whose volume is equal to the volume per conduction electron. Fermi wavelength – defined as the de Broglie wavelength of the conduction electrons at the Fermi level.
EEW508 V. Electrical Properties at Surfaces Jellium model The ion cores are replaced by a uniform sea of positive charge, having the same average charge density. The crystal surface is the edge of this area of positive charge.
EEW508 V. Electrical Properties at Surfaces Jellium model
EEW508 V. Electrical Properties at Surfaces Interface dipole formation At the surface, the electrons are bound only toward the positive background on the bulk side, and they can spill out by tunneling into the vacuum, resulting in exponential dropping of electron density from the surface. This charge separation leads to the formation of the surface dipole. (Unit: Fermi wavelength)
EEW508 V. Electrical Properties at Surfaces Surface dipole formation + - - + - + bulk vacuum - + For a metal, the free conduction electron density is high (~ 1 el/atom), and screening of the metal atoms by the large free-electron density is effective. Spatial extent of the surface dipole decreases as the electron density in the bulk increases.
EEW508 V. Electrical Properties at Surfaces Energy level diagram The surface dipole causes an increase of electrostatic energy of electrons when they move across the surface region into vacuum. This electrostatic energy potential vdipole(x) is called as surface dipole potential The interaction between electrons is taken account by introducing the exchange-correlation energy. The work function is the minimum potential that the most loosely bound valence electrons (at the Fermi level) in the solid must overcome to be ejected into the vacuum.
EEW508 V. Electrical Properties at Surfaces Effect of surface structure on work function The surface structure sensitivity of work function mainly comes from the surface dipole potential since other two terms are basically bulk properties. The surface with higher roughness exhibits low work function
EEW508 V. Electrical Properties at Surfaces Effect of surface structure on work function J. Phys. C:Solid State Phys. 15, 2305 (1982)
EEW508 V. Electrical Properties at Surfaces Effect of surface roughness on work function The valence electron in the rough surface smooth out the roughness in the positive charge distribution. The result is an electrostatic dipole orientated opposite to the spill-out dipole. As a result, the net dipole is reduced relative to its value at the higher-atomic-density, smoother surface, yielding a lower work function. Schematic picture of surface electron charge density for (a) flat and (b) rough surfaces. (a) shows the large surface dipole and high work function, and (b) small surface dipole and low work function
EEW508 - - - - - - - + + - + + + + + + V. Electrical Properties at Surfaces Effect of surface steps on work function vacuum step The Smoluchowski effect: the formation of electrostatic dipoles at atomic steps bulk The net dipole at the atomic steps is reduced relative to its value at the higher-atomic-density, smoother surface This indicates that atomic steps modify the electronic structure of flat surfaces. Steps on conducting surfaces can have a dipole moment arising from the incomplete screening of the positive ion cores by conduction electrons.
EEW508 V. Electrical Properties at Surfaces Effect of surface steps on work function The work function decreases linearly with increasing step density. The induced dipole moment due to steps can be calculated from the work-function change because = 4 Ns where Ns is the step density
EEW508 V. Electrical Properties at Surfaces Adsorption induced charge transfer at surfaces
EEW508 V. Electrical Properties at Surfaces Work function of various elements
EEW508 V. Electrical Properties at Surfaces Unit of dipole The debye (symbol: D) is a CGS unit (a non-SI metric unit) of electric dipole moment named in honor of the physicist Peter J. W. Debye 1D = 10-10 esu·Å =3.33564 × 10⁻³⁰ C·m Typical dipole moments for simple diatomic molecules are in the range of 0 to 11 D. Symmetric homoatomic species, e.g. chlorine, Cl2, have zero dipole moment and highly ionic molecular species have a very large dipole moment, e.g. gas phase potassium bromide, KBr, with a dipole moment of 10.5 D
EEW508 V. Electrical Properties at Surfaces Surface energy • Most experimental work was obtained from surface tension of liquid metals • Theoretical modeling • In the jellium model, taking energy difference between the split and unsplit crystal leads to three terms • = s + xc + dipole • where s is the kinetic energy change between the split and unsplit crystal, and xc is difference of the exchange correlation energy between the split and unsplit crystal, and dipole is the surface dipole layer contribution • Another approach is DFT calculation with pseudopotential with exact atomic structure. Comparison of DFT results of the surface energy with experimental results
EEW508 Normal force Friction force Tip-sample current Schematic of combined apparatus of AFM/STM V. Electrical Properties at Surfaces Case study -Probing step dipole with scanning probe microscopy
EEW508 V. Electrical Properties at Surfaces Probing step dipole with scanning probe microscopy electrostatic force between a metallic tip and a plane dielectric sample for different tip sample distances varies, but it doesn’t have the polarity dependence. Small atomic package at the steps induces a less attractive force. The polarization of the steps is smaller than the polarization of the terraces.
EEW508 V. Electrical Properties at Surfaces Sensing dipole fields at atomic steps with combined scanning tunneling and force microscopy (a) STM-AFM configuration using a conductive cantilever bending in response to forces. (b) 70 nm x 70 nm STM image of a Pt (111) surface (Vt = –0.2V, I=0.16nA). (c) Height and force profile across the steps. The force on the tip is more attractive at the bottom of the steps and less attractive at the top. (d) Force image simultaneously acquired with (b). Yellow and blue colors represent low and high attractive forces, respectively.
EEW508 V. Electrical Properties at Surfaces A difference between the positive and negative polarization leads to the step dipole moment Permanent dipole moment per atom: Gold (111): P=0.3D/step atom 2-fold Quasicrystal: P=1D/step atom The permanent dipole moment increases when the atomic package at the step decreases Distance between atoms at the step: Gold (111): 1.8 A 2-fold Quasicrystal: 4A J. Y. Park et al. Phys. Rev. Lett 95, 136802 (2005).
EEW508 V. Electrical Properties at Surfaces Chemisorption-induced changes in work function Chemisorption of an atom or a molecule leads to charge transfer to or from the metal. This charge transfer results in a large change of work function, with the magnitude of the change depending on the nature of the adsorbate-substrate bond and on the coverage. If we consider well-separated chemisorbed species with surface concentration and, the work function change is given by the Helmholtz equation = -4e Where is the dipole moment induced by the adsorbate. = -3.76 x 10 –5 Where is in eV, is in Debyes, and is the number of adsorbate atoms per cm2 Dipole-dipole interaction causes depolarization, which shows up at higher coverages that modify the Helmholtz equation according to the point-depolarization model developed by Topping = -4e/[1+9 3/2] where is polarizability
EEW508 V. Electrical Properties at Surfaces Chemisorption-induced changes in work function Carbon monoxide increase the work function of Rh(111) upon chemisorption = -4e/[1+9 3/2] Good fitting can be obtained for CO coverage() <0.33 with CO = -0.2 Debye, and CO = 0.34 x 10⁻²⁸ m3 For >0.33, increases dramatically until reaching a value of +1.05 eV at =0.75 The change of work function of Rh(111) upon CO adsorption
EEW508 V. Electrical Properties at Surfaces Chemisorption-induced changes in work function Chemisorption of sodium decreases the work function of Rh(111). = -4e/[1+9 3/2] Using the equation above, we can obtain a surface dipole moment of Na = +5.1 Debye, and Na = 2.9 x 10⁻²⁸ m3 for low sodium coverage. Similar trend can be observed for chemisorption of alkali adatoms on other transition metals as well.
EEW508 V. Electrical Properties at Surfaces • Measurement of work function • Thermionic Emission • Photoemission • Field Emission
EEW508 V. Electrical Properties at Surfaces The Fermi-Dirac probability distribution function The electron in the conduction band follow Fermi-Dirac statistics with the probability of occupancy being given by The Bose-Einstein probability distribution function μ is the chemical potential, k is the Boltzmann constant, and T is temperature.
EEW508 V. Electrical Properties at Surfaces Density of state curve for the conduction band of a free electron metal The electron in the conduction band follow Fermi-Dirac statistics with the probability of occupancy being given by At T=0K, all of the states for which will be filled and all states for which > will be empty. The value of corresponding to = is called the Fermi energy. At temperature above 0 K, the probability of occupancy of states just above F becomes finite. Surface Science; An Introduction J. B. Hudson (1992)
EEW508 V. Electrical Properties at Surfaces Measurement of work function – a. Thermionic emission At high temperature, states with -F > will have a probability of occupancy given by Where - ( +) represents the energy in excess of that needed to reach the vacuum level. Any electron with - ( +) >0 is essentially outside of the crystal and can be collected as a free electron. Such electrons are called thermionic electrons and the process by which they are produced is called thermionic emission.
EEW508 V. Electrical Properties at Surfaces Measurement of work function- a. Thermionic emission Richardson-Dushman equation The expression relating thermionic current j to temperature Where A = 4 mk2e/h3 ~ 120 A /cm2 deg2 To obtain work function from a thermionic emission measurement, one plots ln (j/T2) as a function of 1/T Plot of Richardson-Dushman equation For different faces of tungsten
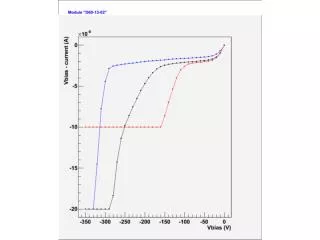
EEW508 V. Electrical Properties at Surfaces Thermionic emission at metal-semiconductor Schottky diode assumes that electrons, with an energy larger than the top of the barrier, will cross the barrier provided they move towards the barrier For thermionic emission over the barrier, the current density of Schottky contacts as a function of applied voltage is given by Where F = Area, Φn = Schottky Barrier Height, η = Ideality Factor, Rs = Series Resistance, respectively. A* [Effective Richardson Constant] = 4 m* k2e/h3 The effective mass of the conduction electrons in GaN, m* = 0.22m0, gives an effective Richardson constant A* (GaN) = 2.64 x 10⁴ A/cm2K. The effective Richardson constant for TiO2 is A = 24 A/cm2K. Energy diagram of metal-semiconductor Schottky diode
EEW508 V. Electrical Properties at Surfaces Measurement of work function- b. Photoelectron emission Any photon incident on the sample surface can interact with an electron in the solid to transfer its energy to the electron. If this energy is greater than the difference between the initial energy of the electron and the vacuum energy, then the electron may escape from the solid. This process is called photoelectron emission. The ejected electrons are called photoelectrons. If the minimum photon energy, hvo, can cause electron ejection, the work function () is the same with hvo Vacuum level hvo Fermi level
EEW508 V. Electrical Properties at Surfaces Photoelectron emission- Fowler law The total electron current generated in this process is given by the Fowler equation Where B is a parameter that depends on the material involved. If measurements are made of the photoemitted current as a function of photon energy, extrapolation allows the determination of vo, thus
EEW508 V. Electrical Properties at Surfaces Measurement of work function- c. Field emission If a strong electric field is present at the surface with the surface electrically negative wrt the surroundings, the effective surface barrier will be modified with smaller height and width. In this case, a quantum mechanical calculation indicates that electrons can escape through the barrier by quantum mechanical tunneling and appear in the space outside the metal as field-emitted electrons
EEW508 V. Electrical Properties at Surfaces Measurement of work function- c. Field emission Fowler-Nordheim equation The current arising from this process is given by the Fowler-Nordheim equation as Where F is the electric field strength, and is a slowly varying function of F, of the order of unity. A plot of this relation, ln (j/F2) vs (1/F) can be used to determine work function
EEW508 V. Electrical Properties at Surfaces Field Emission (Fowler-Nordheim equation) If we change this equation to the more feasible form where, is work function in eV, I is the emission current in A, V is the applied voltage in V. In this equation, is called the field enhancement factor, and defined as E= V Likewise, I=JA, where A is the effective emitting area of electron source in cm2.
EEW508 V. Electrical Properties at Surfaces Field Emission (Fowler-Nordheim equation) • The range of electrostatic field for field emission is 3 - 7 x 10 7(V/cm). The field E at the surface of a free sphere of radius r and potential V is E = V / r • At the surface of an actual tip, the field is reduced from this value by the presence of the cylindrical or conical shank, is given to a very good approximation by • E = V / kr, where k ~ 5 • In other words, for the sharp field emission source, • is 1/kr and is not significantly dependent on the distance between the tip and anode. • In case of the planar field emission source as like diamond, DLC(Diamond like carbon), and boron nitride, is inversely proportional to the tip-anode distance. increases from 3.27 x 10⁵ to 7.98 x 105 cm -1 as the tip approaches an anode from distance of 30 m–500 nm. Park et al. Rev. Sci. Instru. (1999).
EEW508 Electrical Properties at Surfaces Measurement of work function- c. Field emission Field emission microscopy The contrast observed in FEM arises from the variation in work function with crystallographic orientation over the tip. Field emission microscopy image of a clean Rh(111) This technique along with F-N plot, allows the measurement of the variation of work function with orientation. FEM(field emission microscopy) has been used to measure adsorption and surface diffusion processes.