Download
1 / 30
300 likes | 308 Vues
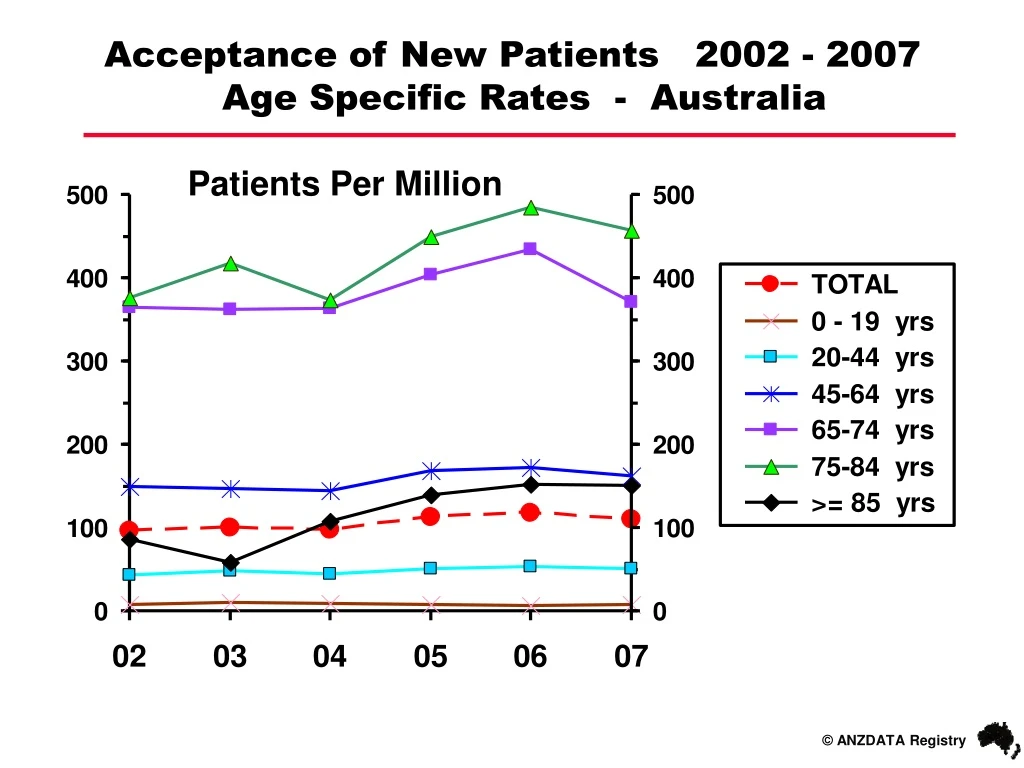
Acceptance of New Patients 2002 - 2007 Age Specific Rates - Australia. Patients Per Million. Acceptance of New Patients 2002 - 2007 Age Specific Rates - New Zealand. Patients Per Million. 130. 120. 110. New RRT (per million per year). 100. 90. 80. 2001. 2002. 2003. 2004.

E N D
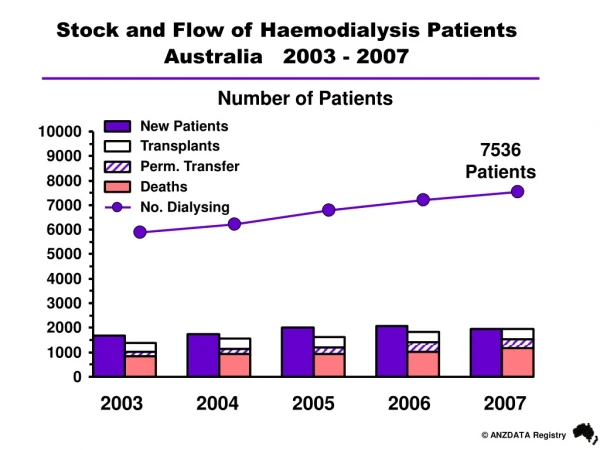
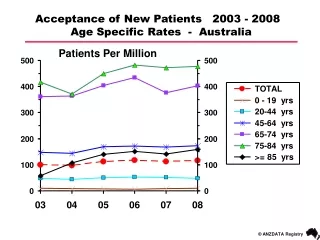
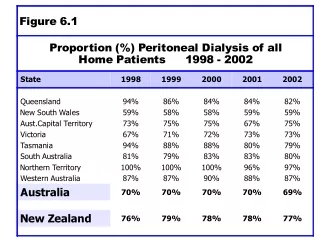
Acceptance of New Patients 2002 - 2007 Age Specific Rates - Australia Patients Per Million
Acceptance of New Patients 2002 - 2007 Age Specific Rates - New Zealand Patients Per Million
130 120 110 New RRT (per million per year) 100 90 80 2001 2002 2003 2004 2005 2006 2007 Year New RRT Rates - Queensland
New RRT Rates - New South Wales 130 120 110 New RRT (per million per year) 100 90 80 2001 2002 2003 2004 2005 2006 2007 Year
New RRT Rates - ACT 140 120 100 New RRT (per million per year) 80 60 2001 2002 2003 2004 2005 2006 2007 Year
New RRT Rates - Victoria 120 110 New RRT (per million per year) 100 90 80 2001 2002 2003 2004 2005 2006 2007 Year
140 120 100 New RRT (per million per year) 80 60 40 2001 2002 2003 2004 2005 2006 2007 Year New RRT Rates - Tasmania
140 120 New RRT (per million per year) 100 80 60 2001 2002 2003 2004 2005 2006 2007 Year New RRT Rates - South Australia
500 400 New RRT (per million per year) 300 200 2001 2002 2003 2004 2005 2006 2007 Year New RRT Rates - Northern Territory
130 120 New RRT (per million per year) 110 100 90 2001 2002 2003 2004 2005 2006 2007 Year New RRT Rates - Western Australia
New RRT Rates by Age Group Queensland 500 400 65+ 300 New RRT (per million per year) 45-64 25-44 <25 200 100 0 2001 2002 2003 2004 2005 2006 2007 Year
New RRT Rates By Age Group New South Wales 500 400 65+ 300 New RRT (per million per year) 45-64 25-44 200 <25 100 0 2001 2002 2003 2004 2005 2006 2007 Year
New RRT Rates By Age Group ACT 800 600 65+ New RRT (per million per year) 45-64 400 25-44 <25 200 0 2001 2002 2003 2004 2005 2006 2007 Year
New RRT Rates By Age Group Victoria 500 400 65+ 300 New RRT (per million per year) 45-64 25-44 200 <25 100 0 2001 2002 2003 2004 2005 2006 2007 Year
New RRT Rates By Age Group Tasmania 500 400 65+ 300 New RRT (per million per year) 45-64 25-44 <25 200 100 0 2001 2002 2003 2004 2005 2006 2007 Year
New RRT Rates By Age Group South Australia 400 300 65+ New RRT (per million per year) 45-64 200 25-44 <25 100 0 2001 2002 2003 2004 2005 2006 2007 Year
New RRT Rates By Age Group Northern Territory 2500 2000 65+ 1500 New RRT (per million per year) 45-64 25-44 1000 <25 500 0 2001 2002 2003 2004 2005 2006 2007 Year
New RRT Rates By Age Group Western Australia 600 500 400 65+ New RRT (per million per year) 45-64 300 25-44 <25 200 100 0 2001 2002 2003 2004 2005 2006 2007 Year
Comorbid Conditions at Entry to RRT Australia 45 40 35 Coronary 30 Peripheral Vascular Percentage 25 Cerebrovascular 20 Lung 15 10 2001 2002 2003 2004 2005 2006 2007 Year starting RRT
Comorbid Conditions at Entry to RRT New Zealand 45 40 35 Coronary 30 Peripheral Vascular Percentage 25 Cerebrovascular 20 Lung 15 10 2001 2002 2003 2004 2005 2006 2007 Year starting RRT
Smoking Status at Entry to RRT Australia
Smoking Status at Entry to RRT New Zealand
Diabetes Status at Entry to RRT Australia
Diabetes Status at Entry to RRT New Zealand
Biopsy Rates - Australia 40 35 30 Biopsy rate (%) 25 20 15 1998 1999 2000 2001 2002 2003 2004 2005 2006 2007 Year
Biopsy Rates - New Zealand 40 35 30 Biopsy rate (%) 25 20 15 1998 1999 2000 2001 2002 2003 2004 2005 2006 2007 Year
Biopsy Rates: Glomerulonephritis Australia 100 90 80 Biopsy rate (%) 70 60 50 40 1998 1999 2000 2001 2002 2003 2004 2005 2006 2007 Year
Biopsy Rates: Glomerulonephritis New Zealand 100 90 80 Biopsy rate (%) 70 60 50 40 1998 1999 2000 2001 2002 2003 2004 2005 2006 2007 Year
Biopsy Rates: Diabetic Nephropathy Australia 25 20 15 Biopsy rate (%) 10 5 0 1998 1999 2000 2001 2002 2003 2004 2005 2006 2007 Year Type 1 DM Type 2 DM
Biopsy Rates: Diabetic Nephropathy New Zealand 25 20 15 Biopsy rate (%) 10 5 0 1998 1999 2000 2001 2002 2003 2004 2005 2006 2007 Year Type 1 DM Type 2 DM