Download
1 / 17
170 likes | 174 Vues
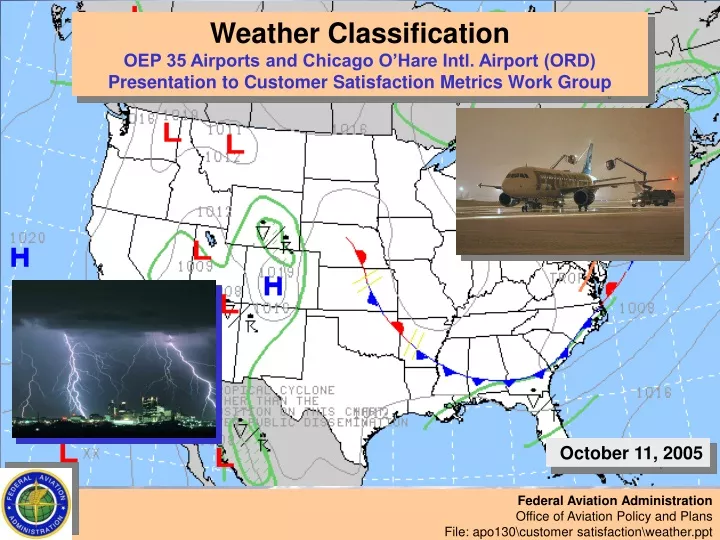
Weather Classification OEP 35 Airports and Chicago O’Hare Intl. Airport (ORD) Presentation to Customer Satisfaction Metrics Work Group. October 11, 2005. Federal Aviation Administration Office of Aviation Policy and Plans File: apo130customer satisfactionweather.ppt. Purpose.

E N D
Weather Classification OEP 35 Airports and Chicago O’Hare Intl. Airport (ORD) Presentation to Customer Satisfaction Metrics Work Group October 11, 2005 Federal Aviation Administration Office of Aviation Policy and Plans File: apo130\customer satisfaction\weather.ppt
Purpose • To classify weather on an hourly basis by airport as having • None • Minor • Moderate • Severe impact on airline scheduled flights. How Would the Classification Be Used? • Compare one time period to another in terms of percent of operations in each weather category. • Use as an explanatory measure for changes in delay metrics. • Be able to assess FAA procedural or technical improvements in handling flights in ‘bad weather’. 2
Underlying Principles • Data must be readily available. • Methodology needs to be simple and easily explained. • Percentage of operations in each weather category must pass the reasonableness test for each airport and also for each month. • Appropriate delay measures • Percent on-time departures • Percent on-time arrivals • Average delay for all departures • Average delay for all arrivals move in the right direction as the weather classification moves from none to severe. 3
Impacting Conditions Analyzed • Wind. • Ceiling. • Visibility. • OPSNET recorded weather delays. • Severity of local weather conditions. • Thunderstorms reported at nearby weather stations (50 miles). • Airport arrival and departure rates (AAR and ADR). • Enroute thunderstorms Note: - A weight value is applied to each impacting condition (0: not significant, 1: significant, 2: very significant, 3: extremely significant). 4
Comments on Scenario Interface • The interface allows users to create and save scenarios by changing the key weather parameters. • Each factor can be assigned a weight from 0 to 3 depending on the impact. • For each impacting condition, the ranges were determined by examining the distribution and the impact on the percent on-time arrivals from January 2000 through December 2004. • Wind speed, ceiling and visibility are the three factors that if severe than an hour can be marked as severe regardless of the overall condition. • For ORD, wind is characterized as ‘none’ (0) if the speed is between 0 and 10 knots, ‘minor’ (1) from 11 to 14, ‘moderate’ (2) from 15 to 21 and ‘severe’ (3) greater than 22 knots. • The overall score is the weighted average of the eight weather factors (wind, ceiling, visibility, OPSNET weather delays, local weather, nearby thunderstorms, AAR, enroute thunderstorms). • Local weather, nearby thunderstorms, enroute thunderstorms are extracted from the data at the applicable weather stations. 6
None: 73.25 Minor: 10.63 Moderate: 10.37 Severe: 5.75 10
None: 82.15 Minor: 74.61 Moderate: 64.71 Severe: 47.71 Overall: 75.63 11
None: 56.80 Minor: 7.45 Moderate: 27.07 Severe: 8.68 12
None: 85.54 Minor: 77.92 Moderate: 63.10 Severe: 32.96 Overall: 72.37 13
None: 97 Minor: 92 Moderate: 85 Severe: 69 14
Validation for Percent On-Time Arrivals (Flight Plan) • Six tests each period • Percent on-time in none should be greater than percent on-time in minor, moderate, or severe (3 tests). • Percent on-time in minor should be greater than percent on-time in moderate and severe (2 tests). • Percent on-time in moderate should be greater than percent on-time in severe (1 test). 15
Weather Severity Methodology Used in ASPM Airport hourly weather severity value is derived form the ASOS weather type or the ASOS weather attribute that is reported at the local ASOS weather stations. The type and attribute are assigned a severity code according to the table below that range between 1, 2 or 3 with the highest severity code observed per hour being used to represent the airport hourly severity rating for all the flights in that hour. The type and attribute are from the ASOS data field "Weather Type" that are recorded twice an hour in record type "AA" (Hourly METAR Report) or record type "SP" (METAR Special Report). 16