Download
1 / 11
110 likes | 212 Vues
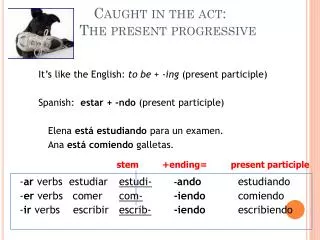
Caught in the Web. Results of the Sustainability Survey February 2014 Health, Safety & Environment Service RUG Dick Jager Dick de Waard Together with Kathrin-Luise Hahn Rutger Mulder. Events leading up to the Sustainability Survey.

E N D
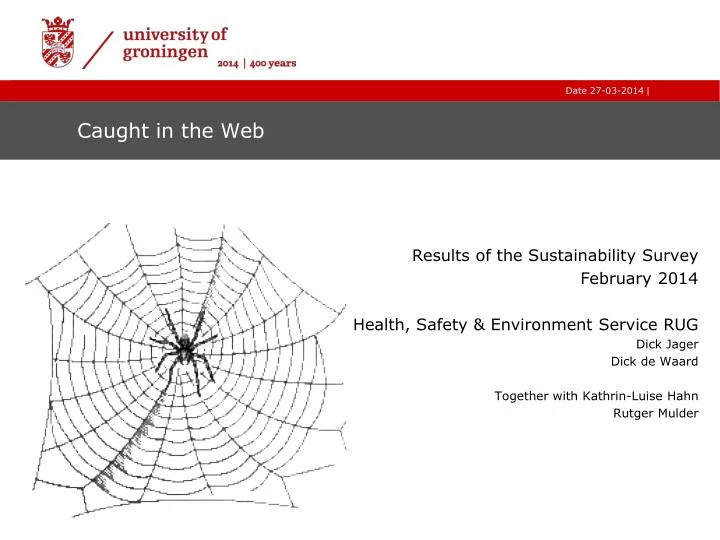
Caught in the Web Results of the Sustainability Survey February 2014 Health, Safety & Environment Service RUG Dick Jager Dick de Waard Together with Kathrin-Luise Hahn Rutger Mulder
Events leading up to the Sustainability Survey In late 2012, an intensive workshop concerning sustainability was held at the University of Groningen under the guidance of EY’s external advisors. Around 15 people participated in the workshop on behalf of the university. The group of participants was composed in such a way as to ensure a certain extent of representativeness. As a result, students, professors, representatives of the various support services and a member from the Board of the University all participated. During the workshop, a variety of topics and issues related to sustainability were extensively discussed. Sustainability is a broad concept, so it is not merely about the environment and energy. In the workshop, an initial selection of relevant topics was made. These topics are classified into six overarching themes: Economy, Environment, Labor Conditions, Human Rights, Society and Product Responsbility. In early 2014 it was decided that based on the results of the intensive workshop, a survey should be held among all the staff and students in order to determine the importance they attach to a group of selected topics. This led to the creation of the Sustainability Survey that was presented via e-mail by the Board of the University in February 2014. The survey yielded 1.770 usable and completed responses. A number of salient findings are explained in this report. This survey is especiallly focused on gaining insight into the views and aspirations of staff members and students concerning the field of sustainability.
Data Sample The pie charts below present the distribution of the sample in terms of gender, nationality and relationship to the RUG. A total of 1770 usable completed surveys were received, consisting of: • 966 women and 804 men • 1487 Dutch and 283 foreigners • 516 academic staff, 456 non-academic staff and 798 students. This indicates that (from a total of 28,000 students and 7,000 staff) around 2,8% of the students and 14% of the staff filled in the survey.
Comparison of survey results with expert group of 2012 Below are the general results per theme as illustrated by a spiderweb diagram. The diagram on the left portrays the results from the survey and the diagram on the right shows the results of the choices made by the expert group of 2012 (see previous). We see that the total sample (survey) assigns equal value to each theme. This is contrasted by the expert group, which assigns less value to human rights and social responsibility. The expert group also sees less need for improvement in comparison to the total sample. It is noteworthy that the spiderweb diagrams of the subgroups (men, women, Dutch, foreigners, academic staff, non-academic staff and students) are almost identical to that of the total sample and are therefore not shown separately.
Possible score 5 = leader 4 = pursuers 3 = peloton 2 = stragglers 1 = broom wagon Striking results • The survey provides a few notable outcomes. The most striking are listed below. • Almost all topics are regarded as important and are assigned a score of 4, with the exception of: • Quality of education: score of 5 • Animal testing: score of 3 • The current situation is valued at a 3 in almost all cases except: • Number of students: score of 4 • Number of foreign students: score of 4 • Academic ranking: score of 4 • The most frequent answer for the desired situation varies between 4 and 5. Exceptions (valued with a 3) are: • Number of students • Number of foreign students • Number of staff • Animal testing • Diversity in staff • Participation in charity These results reveal that the respondents – considering the broad range of sustainability issues – attach great importance to the quality of education and less importance to animal testing, despite this being a much-discussed topic. Moreover, the respondents believe that the number of students (both Dutch and foreign) and the academic ranking both score above average in the current situation. A peculiar outcome is observed concerning this topic (see the subsequent ‘gap analysis’) Lastly, the respondents feel that (regarding the provision of information) improvements can be made in nearly all sustainability themes with the exception of the topics listed on the left-hand side.
'Gap-analysis‘ – differencebetweencurrent and desiredsituation In the bar chartdisplayedbelow we show the gap between the current and the desiredsituation. Fromthis bar chart we canconcludethatfemaleparticipants are more ambitioussincetheysee more room forimprovementson all sustainabilitythemescompared to men. Especially on the themes: environment, labor conditions and society. The participants see most room for improvement on the environmental theme.A possible explanation for this finding is that people strongly associate sustainability with the environment. Respondents see the least room for improvements on the economy theme, which is possibly because people do not link economic themes to sustainability.
'Gap-analysis‘ – difference between current and desired situation Non-academicstaff is more ambitiouson all sustainabilitythemescompared to academicstaff and students. This can be explained by the fact that this ‘other staff’ group is more directly involved in operational tasks. Another reason might be the high proportion of female employees in the ‘other staff’ group; as can be seen on the previous slide, female respondents are more critical. A veryremarkablefinding is thatstudents (regardless of origin) consider the number of students to becompleteley irrelevant. There is a differencebetween Dutch and foreignstudents. It remains unclear whether they consider the number of students to be too high or whether they consider this an irrelevant question regarding sustainability.
What have we learned? Sincepeopletend to link sustainabilitymainlywithenvironmental and energythemes, itseems to be of greatimportancethat the executive board starts to communicateothersustainabilityinitiatives of the RuG more clearly. Anexamplemightbe the communication of initiativesonsustainable society and the associated goals of the RuGonthistheme. Communicationturns out to be the key. The respondents have chosen the ‘safe option’ when deciding on the current and desired situation by downscaling their ambitions. Thisleadsus to concludethat the respondents are notfamiliarwith the ambitions and achievements of the university in the field of sustainability. • The mainfindings of the survey are: • - Manyrespondents have difficultiesdeterminingwhichthemes are related to questionsonsustainability – some of the abovementionedthemeswerenotrecognized as such. • Respondentsexperiencedifficulties in attachingweights (in terms of importance) to the different themes/questions. • Itappeared to bedificult to differentiatebetween the themes in terms of the desiredsituation. • Thereseems to besomeunfamiliaritywith relevant themes.