Download
1 / 77
770 likes | 882 Vues
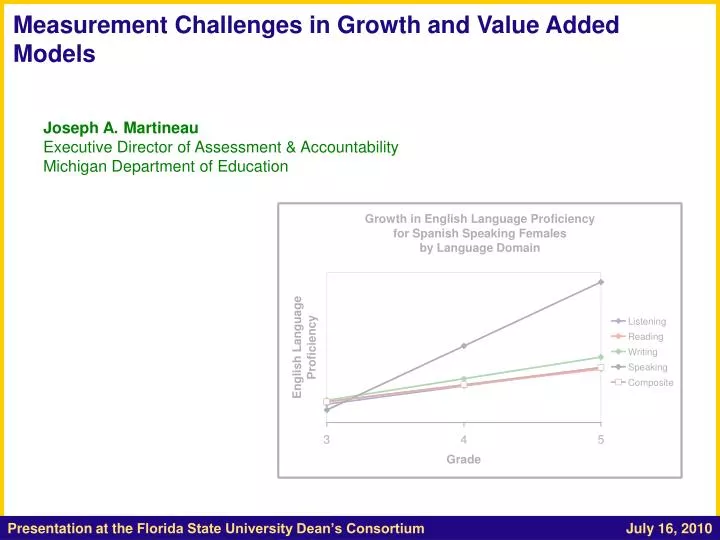
Presentation at the Florida State University Dean’s Consortium July 16, 2010. Measurement Challenges in Growth and Value Added Models. Joseph A. Martineau Executive Director of Assessment & Accountability Michigan Department of Education. What is a Construct?.

E N D
Presentation at the Florida State University Dean’s Consortium July 16, 2010 Measurement Challenges in Growth and Value Added Models Joseph A. Martineau Executive Director of Assessment & Accountability Michigan Department of Education
What is a Construct? • Theoretical definition? • Content experts usually define constructs with high levels of dimensionality for sub-constructs with theoretically important differences in meaning • Each dimension or sub-construct can typically be considered its own construct worthy of individual study • Statistical abstraction? • Psychometricians and statisticians usually define constructs with low levels of dimensionality • Depends on correlations among sub-constructs • A combination? • I fall into this camp • A construct is a characteristic that is… • Theoretically distinguishable • Statistically distinguishable • High correlations does not mean the constructs are indistinguishable • Highly correlated constructs may be affected differently by different interventions
Construct Definition • Traditional psychometric assumptions about constructed measures include that measures are… • Unidimensional • Sensitive to only a single construct • Measure only a single thing • On an interval-level scale • Changes of the same magnitude on different parts of a scale indicate the same amount of change • Implies that the measures are also linear
Counterexamples in the Simple Case • Start out with counterexamples within a single grade level • Grade 8 • Mathematics • Based on Michigan Grade Level Content Expectations • Based on the Michigan Educational Assessment Program (or MEAP)
A Theoretical Counterexample to the Unidimensionality Assumption Taken from the percentage of Michigan mathematics grade level content expectations covering each strand. Theoretically, math is multidimensional. Traditional statistical tests say math is unidimensional. Depends on the claim that because the sub-scales are highly correlated, it’s all just undifferentiated mathematics Question: Are there interventions (including teachers) that help greatly with number & operations, but not so much with algebra? If so, can we claim that math is a unidimensional, undifferentiable construct? From a theoretical perspective high correlations do not mean that subscales should be modeled as a single construct
But, those are just theoretical concerns. The statistics show that you can just treat the subscales as a single overall scale Can you show me an empirical example of where this matters?
An Empirical Counterexample (from Martineau et al, 2007) Created a composite math scale, placed subscales on the “same scale.” Ordered students on the composite math scale. Created 100 groups of students of about 1,100 students each. Obtained average composite math score of the 100 groups Obtained average sub-scale scores of 100 groups on the three subscales Plotted in a three-dimensional achievement space
An Empirical Counterexample (from Martineau et al, 2007) Highest achieving group of about 1,100 students on the composite mathematics scale Lowest achieving group of about 1,100 students on the composite mathematics scale
An Empirical Counterexample 3-D Composite scale: passes all traditional unidimensionality tests. Projections of 3-D composite onto 2-D composite. If the composite scale is unidimensional and linear, all four plots should be linear and identical. However, changes near the lower end of the scale mostly represent improvement in number & operations and geometry.
An Empirical Counterexample Important results: composite scale changes meaning over its range, and is multidimensional, non-linear, and non-interval Statistical models that rely on these scale characteristics will result in distorted interpretations
Implications • If scales traditionally considered unidimensional, linear, and interval are sometimes none of the three… • How badly affected are the results of statistical models that use those scales as outcomes? • Can powerful statistical models that require those scale characteristics still be used? • Essentially, why should I care whether the assumptions are violated?
Theoretically, how badly can value-added be affected • Simplest case theoretical thought experiment • Scenario • Teacher A vs. Teacher B as a reading intervention • A true experiment, assigning students randomly to either Teacher A or Teacher B • A composite reading measure • Sensitive to both decoding and comprehension • More sensitive to decoding than comprehension • Does not change meaning over its range • Known impacts • Teacher A increases gains in comprehension • Teacher B increases gains in decoding by the same amount • Teacher A has no impact on decoding • Teacher B has no impact on comprehension • Results should identify both as equally effective, but on different parts of the reading construct • Next slides—graphical representations of the thought experiment
Simple Thought Experiment • Comparisons • Results • Accurate • Equal impact of Teacher A and Teacher B, but on different dimensions of reading achievement • Observed • Teacher B is better than Teacher A at improving reading achievement • Policy recommendations • Accurate • Assign teacher A to take PD on instruction in reading comprehension • Assign teacher B to take PD on instruction in decoding • Observed • Give Teacher A PD in reading
Theoretically, how badly can value-added be affected? • Next simplest case theoretical thought quasi-experiment • Scenario • Teacher A vs. Teacher B as a mathematics intervention • A quasi-experiment • Existing groups (e.g., classes taught by teacher A vs. teacher B) • Select teacher A and B to assure matching samples on pre-test mathematics measure • A composite mathematics measure • Sensitive to both algebra and geometry • Scale changes meaning over its range • Known impacts • Teacher A is more effective in eliciting growth in geometry achievement • Teacher B is of average effectiveness in eliciting growth in geometry • Teacher A and B are both of average effectiveness on eliciting growth in algebra • Results should identify teacher A as the more effective teacher • Next slides—graphical representations of the thought quasi-experiment
Simple Thought Quasi-Experiment (from Martineau et al, 2007) Used the Geometry/ Algebra composite from the empirical example as the scale in this thought experiment
Simple Thought Quasi-Experiment • Comparisons • Results • Accurate • Teacher A is more effective in eliciting geometry growth • Teacher A and B are equally effective in eliciting algebra growth • Observed • Teacher B is more effective in eliciting mathematics growth • Policy recommendations • Accurate • Reward Teacher A • Observed • Reward Teacher B
Summary to this point • Limited thus far to within-grade measures (or horizontal scales) • Theoretical demonstration that content standards within a content area are multidimensional • Empirical demonstration that a content achievement measure contains multiple dimensions (sub-scales) that behave differently • Theoretical demonstration that ignoring multidimensionality can distort the results of experiments and quasi-experiments in value-added; even to the point of reversing a finding
Multidimensionality in Cross-Grade (Vertical) Scales: Adding Another Layer of Complexity • To this point, the presentation has been limited to within-grade (or horizontal) scales • Value Added Models in education tend to… • Cover multiple years • Cover multiple grades • Cover broad ranges of achievement • Cover changing foci of instruction • To allow for such broad coverage, we need… • Cross-grade (or vertical) scales
A Further Theoretical Counterexample to the Unidimensionality Assumption Mathematics is not only multidimensional, but the proportional coverage of dimensions change across grades Note, especially, the change from grade 6 to grade 7. The coverage of algebra raises from 0% in grade 6 to about 35% in grade 7. It seems unreasonable to claim that we are measuring the same thing across grades This cross-grade change in coverage/meaning is called “construct shift”
Cross-Grade (Vertical) Scale Terminology • Types of vertical scale • Purely unidimensional scales • Measure one and only one construct • Non-construct-shifted, non-composite scales • Empirically unidimensional scales • Measure more than one construct • The proportional representation of the multiple constructs in the overall scale is the same across grades • The scale does not change meaning across grades • Non-construct-shifted, composite scales • Empirically multidimensional scales • Measure more than one construct • The proportional representation of the multiple constructs in the overall scale varies across grades • The scale changes meaning across grades • Construct-shifted, composite scales
How Does Construct Shift Impact the Results of Growth and Value-Added Models? • Mathematical derivation • Growth models • Value-added models • Empirical demonstration • Growth models
Let’s say… • We want to measure the impact of a single teacher (or group of teachers using the same intervention) on student growth • Let x represent whether a student is instructed by a certain teacher (or group of teachers)
Mathematical Derivation of Impact of Construct Shift on Growth Models (from Martineau 2004) • Simplest growth model (2-level HLM, measurements within students, linear gains) What we think we are modeling (with a purely unidimensional measure as the outcome). Best case of what we are actually modeling (with an empirically unidimensional measure as the outcome). Results become more complex , less like what we think we are modeling. Most likely case of what we are actually modeling (with an empirically multidimensional measure as the outcome). Even more complex and less like what we think we are modeling.
Mathematical Derivation of Impact of Construct Shift on Growth Models Analogous Terms Overall intercept (starting point) Effect of teacher x on intercept Overall slope (growth rate) Effect of teacher x on growth rate Problem: red and blue should be in the intercept equation (β0j), green and black should be in the slope equation (β1j). All four are in both for the model using an empirically multidimensional scale!
Mathematical Derivation of Impact of Construct Shift on Growth Models Another Problem: the intercept and slope equations from construct-shifted (empirically multidimensional) scales contain totally irrelevant terms from the regression of proportional construct representation (pc) on time and the regression of (time multiplied by pc) on time
Mathematical Derivation of Impact of Construct Shift on Growth-Based Value-Added Models (from Martineau, 2006) • Simple value-added model (two-level model with measurement occasions cross-nested within both teachers and students) Teacher effect we think we are modeling (with a purely unidimensional measure as the outcome). Best case of what we are actually modeling (with an empirically unidimensional measure as the outcome). More complex and less like what we think we are modeling. Most likely case of what we are actually modeling (with an empirically multidimensional measure as the outcome). Even more complex and less like what we think we are modeling
Mathematical Derivation of Impact of Construct Shift on Growth-Based Value-Added Models Impact of teacher a on unidimensional student gains in year i (what we want) Proportional representation of construct c Impact of teacher a on year i student gains on construct c Impact of all teachers previous to teacher a in year i on student gains on construct c Year i proportional representation of construct c Change in proportional representation of construct c from the previous grade
Mathematical Derivation of Impact of Construct Shift on Growth-Based Value-Added Models Definitely relevant Can be considered relevant (with problems) We can calculate proportion of variance in teacher effects that is construct relevant in construct-shifted (empirically multidimensional) scales Definitely irrelevant
Mathematical Derivation of Percent of Variance in Teacher Effects from Construct Relevant Sources (from Martineau 2006)
Mathematical Derivation of Percent of Variance in Teacher Effects from Construct Relevant Sources (from Martineau 2006) Proportion of teacher effects not attributable to prior teachers
Mathematical Derivation of Percent of Variance in Teacher Effects from Construct Relevant Sources (from Martineau 2006) The proportion that I can impact of the estimate of my effectiveness as a teacher depends on the balance of construct representation in the current grade level test, …
Mathematical Derivation of Percent of Variance in Teacher Effects from Construct Relevant Sources (from Martineau 2006) …on change in construct representation from grade to grade, …
Mathematical Derivation of Percent of Variance in Teacher Effects from Construct Relevant Sources (from Martineau 2006) …on the number of teachers who precede me in the analysis, and …
Mathematical Derivation of Percent of Variance in Teacher Effects from Construct Relevant Sources (from Martineau 2006) …on the population-wide correlation in value-added impacts on the multiple constructs (not on the correlation of the constructs themselves)
Mathematical Derivation of Percent of Variance in Teacher Effects from Construct Relevant Sources (from Martineau 2006) The proportion of the estimate of my effectiveness that I can impact can drop quickly and dramatically depending on my circumstances.
Mathematical Derivation of Percent of Variance in Teacher Effects from Construct Relevant Sources (from Martineau 2006) • How much construct irrelevant variance is acceptable in teacher effects? • In a research study? • In a pay-for-performance measure? • In a teacher evaluation measure used for hiring, firing, promotion, and tenure decisions?
Empirical Demonstration of the Importance of Which Scale is Used • Lockwood, J.R., et al., (2007) • Ran VAM on two mathematics subscales • Variation in VAM measures across subscales was greater than variation across model specifications • Variation within teacher across subscales was greater than variation within subscales across teachers • Correlation between value-added on the two subscales was low • Based on the percent variance from construct relevant sources chart, reliability of value-added based on unidimensional mathematics would be low
From Doran and Cohen (2005) • Bias in vertical linking is so great that they recommended: • Include uncertainty in gains arising from vertical linking bias in the results of Value Added Models • Consider not using value-added models [based on vertical scales] to make causal inferences [about individual teachers or schools], the data are too noisy
Summary to this point • When using cross-grade (vertical scales) • Mathematical demonstration that results of growth models are seriously distorted • Slopes contain intercept terms • Intercepts terms contain slope terms • Both intercept and slope terms contain terms from totally irrelevant regressions of proportional construct weights on assessment occasions • VAM sensitive to what sub-construct is measured • Cautions against causal interpretations based on measurement issues