Download
1 / 19
190 likes | 191 Vues
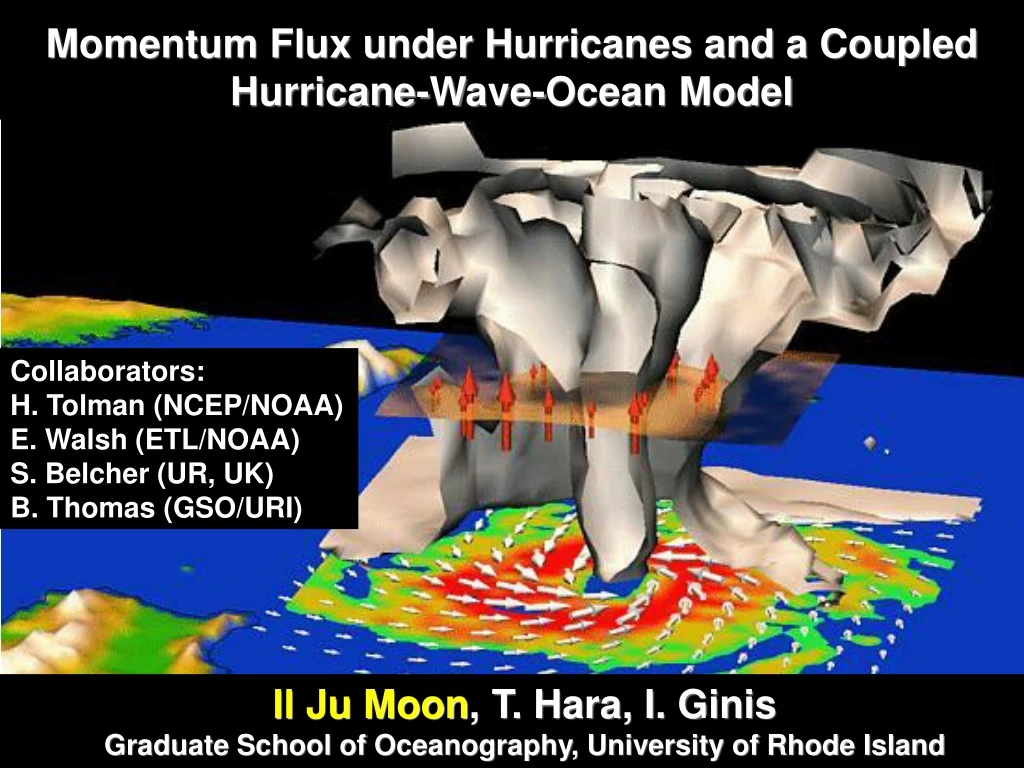
Momentum Flux under Hurricanes and a Coupled Hurricane-Wave-Ocean Model. Collaborators: H. Tolman (NCEP/NOAA) E. Walsh (ETL/NOAA) S. Belcher (UR, UK) B. Thomas (GSO/URI). Il Ju Moon , T. Hara, I. Ginis Graduate School of Oceanography, University of Rhode Island. Hurricane Model (GFDL).

E N D
Momentum Flux under Hurricanes and a Coupled Hurricane-Wave-Ocean Model Collaborators: H. Tolman (NCEP/NOAA) E. Walsh (ETL/NOAA) S. Belcher (UR, UK) B. Thomas (GSO/URI) Il Ju Moon, T. Hara, I. Ginis Graduate School of Oceanography, University of Rhode Island
Hurricane Model (GFDL) Ocean Model (POM) Coupled Hurricane-Wave-Ocean model • - WAVEWATCH III -Wave Boundary Layer model Hara & Belcher (2004) -Spectrum tail model Hara & Belcher (2002) Steady uniform wind experiment Coupled Wave-Wind (CWW) model 1. Idealized hurricanes (Moon et al., 2004a, 2004b, JAS) 2. Real hurricanes (Moon et al., 2004c. GRL)
Idealized Hurricane Experiments Symmetric wind moves northward with hurricane translation speed of 0, 5, 10 m/s 3000km • Arrows: • wind direction • Contours: wind speed After a spinup time of 72 h, a quasi steady state is achieved 1500km
higher longer lower, shorter older younger 0 m/s 5 m/s 10 m/s 0 m/s 5 m/s 10 m/s • Contour: Hs • Arrow : wave • direction • Arrow length : • wavelength Significant wave height • Hurricanes: Complex, multimodal spectrum • Peak freq. of the wind energy input Input wave age In the rear-left quadrant where the youngest waves exist, zch is reduced significantly as HTS increases. Charnock coefficient
+ Scatterplot of drag coefficient vs wind speed Relative position from the storm center 5 m/s 10 m/s Constant zch (0.0185) Mature seas Young seas (uniform wind) • Drag in the front-rightquadrant monotonically increases with the wind speed, which is similar to mature sea results of uniform wind. • Drag in the rear-left quadrant tends to level off or even decrease at high winds, especially for the fast-moving hurricane. This trend is similar to the young sea results of uniform wind experiment. • Predicting a reduced drag at high wind speeds in general. (i) (j)
Real Hurricane Experiments Tracks of 10 hurricanes occurred in the western Atlantic Ocean during 1998-2003: 1. Bonnie (1998), 2. George (1999), 3. Bret (1999), 4. Dennis (1999), 5. Floyd (1999), 6. Gordon (2000), 7. Keith (2000), 8. Lili (2002), 9. Isidore (2002), 10. Isabel (2003).
The best fits of each wind speed group • Different color symbols according to wind speed in 5-m/s intervals • There is a strong correlation between zch and wage for each • wind speed group old young The relationship between Charnock coefficient and input wave age is not unique, but strongly depends on wind speed !!! Scatterplot of Charnock Coefficient vs Input Wave Age Toba et al. (1990) All data points for ten hurricanes Donelan (1990) Open ocean Donelan (1990) Laboratory Because of large scatter, it is difficult to find a unique relation ship between zch and wage
Reduced drag coefficient at high wind speed Scatterplot of Cd as a function of wind peed for ten hurricanes. • Drag coefficient levels off at very high wind speeds • This is significantly different from the two surface flux parameterizations. Our results are more consistent with recent field observations • Under hurricane wind forcing waves are extremely young at high wind speeds and the young waves produce small drag. • This explains why drag coefficient levels off at high wind speed. Results for real hurricanes GPS sonde observation
Hurricane Ocean Wave A Coupled Hurricane-Wave-Ocean Model
The present operational GFDL/URI Model The Coupled Hurricane-Wave-Ocean Model Atmosphere Atmosphere GFDL Hurricane Model GFDL (WRF) Hurricane Model Wind & Air Temp. Flux Wind & Air Temp. Flux SST Wave Boundary Layer Model SST SST & Current Wave Spectra Flux Flux POM (HYCOM) Currents, NCEP WAVEWATCH III POM Elevations, & SST Ocean Ocean Waves
Hurricane Ivan, Initial time: 00Z 12 Sep • Uncoupled: The present operational model • Coupled: Coupled hurricane-wave-model Difference Levels off at high speeds A constant Charnock coefficient (0.0185) is used in the present operational model.
Spatial Distribution of Drag Coefficient Coupled Uncoupled Wave Fields Hurricane Ivan Initial time: 00Z 12 Sep • The new coupled model : Cd is clearly asymmetry relative to the storm center, which is determined by the asymmetry of the hurricane-generated wave field. • The operational model: Cd is simply determined by wind fields regardless of wave field. So, the difference is large
Improvement of hurricane wind structure Uncoupled Coupled Hurricane Isabel Initial time: 00Z 12 Sep HRD In the new coupled model, maximum wind is located in northeast quadrant of the storm, which is in a better agreement with the HRD wind than the operational model.
Improvement of hurricane intensity forecast Maximum wind speed Minimum pressure Track forecast Hurricane Ivan Initial time: 00Z 12 Sep Track forecast of two models are almost identical, but the intensity forecast is much improved by the wave coupling
Improvement of pressure-wind relationship Observation-based standard relationship strong weak The present operational GFDL model tends to underestimate the surface winds for strong hurricanes. The new coupled model shows a better agreement with observations
Charnock coefficient is mainly determined by two parameters: the inputwave ageand the wind speed, regardless of the complexity of the wave field • At very high winds Charnock coefficient decreases as waves become young.This explains why drag levels off at high wind speed • Wave breaking will be included in the near future. Summary Idealized and real hurricane experiments • As the HTS increases, higher, longer and more developed waves in the right front quadrant of the storm track produce higher sea drag; lower, shorter and younger waves in the rear left quadrant produce lower sea drag. • Drag coefficient levels off at high wind speeds under tropical cyclones. This tendency is consistent with the recent observations
The Coupled hurricane-wave-ocean model • We have developed a coupled hurricane-wave-ocean model by coupling the GFDL/URI hurricane-ocean model with the NCEP WAVEWATCH III wave model and a wave boundary layer model. • Preliminary simulations indicate that the hurricane intensity and structure can be significantly effected by the wave coupling. • More real-case simulations will be done in the near future to assess the impact of the wave coupling on hurricane predictions. • Future work will be directed toward improving the heat flux parameterization in the coupled model and transitioning to the Hurricane WRF.
The End Thank You