Download
1 / 13
140 likes | 196 Vues
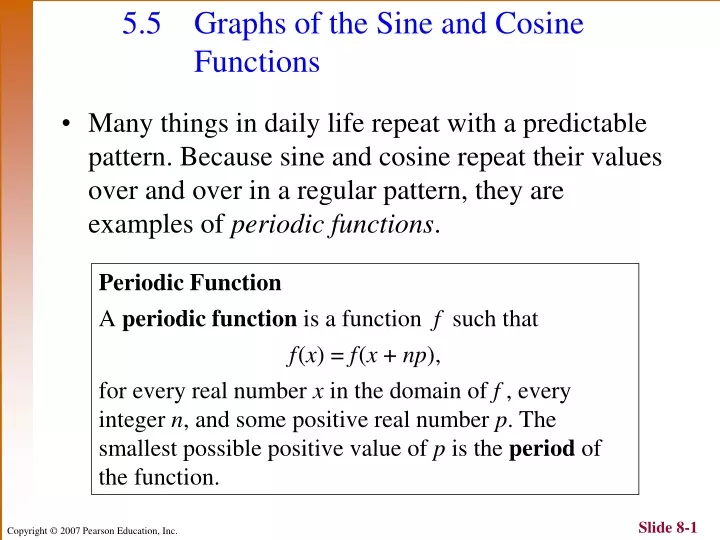
5.5 Graphs of the Sine and Cosine Functions. Many things in daily life repeat with a predictable pattern. Because sine and cosine repeat their values over and over in a regular pattern, they are examples of periodic functions. Periodic Function

E N D
5.5 Graphs of the Sine and Cosine Functions • Many things in daily life repeat with a predictable pattern. Because sine and cosine repeat their values over and over in a regular pattern, they are examples of periodic functions. Periodic Function A periodic function is a function f such that f(x) = f(x + np), for every real number x in the domain of f , every integer n, and some positive real number p. The smallest possible positive value of p is the period of the function.
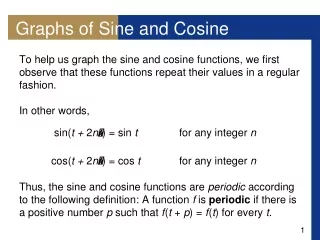
5.5 Graph of the Sine Function • From the graph we can see that as t increases, sin t oscillates between 1. • Using x rather than t, we can plot points to obtain the graph y = sin x. • The graph is continuous on (–,). • Its x-intercepts are of the form n, n an integer. • Its period is 2. • Its graph is symmetric with respect to the origin, and it is an odd function.
5.5 Graph of the Cosine Function • The graph of y = cos x can be found much the same way as y = sin x. • Note that the graph of y = cos x is the graph y = sin x translated units to the left. • The graph is continuous • on (–,). • Its x-intercepts are of the • form (2n + 1) , n an • integer. • Its period is 2. • Its graph is symmetric • with respect to the y-axis, • and it is an even function.
5.5 Graphing Techniques, Amplitude, and Period Example Graph y = 2 sin x, and compare to the graph of y = sin x. Solution From the table, the only change in the graph is the range, which becomes [–2,2].
5.5 Amplitude • The amplitude of a periodic function is half the difference between the maximum and minimum values. • For sine and cosine, the amplitude is Amplitude The graph of y = a sin x or y = a cos x, with a 0, will have the same shape as y = sin x or y = cos x, respectively, except with range [–|a|, |a|]. The amplitude is |a|.
5.5 Period • To find the period of y = sin bx or y = cos bx, solve the inequality for b > 0 • Thus, the period is • Divide the interval into four equal parts to get the values for which y = sin bx or y = cos bx is –1, 0, or 1. These values will give the minimum points, x-intercepts, and maximum points on the graph.
5.5 Graphing y = cos bx Example Graph over one period. Analytic Solution
5.5 Graphing y = cos bx Graphing Calculator Solution Use window [0,3] by [–2,2], with Xscl = 3/4. Choose Xscl = 3/4 so that x-intercepts, maximums, and minimums coincide with tick marks on the axis.
5.5 Sketching Traditional Graphs of the Sine and Cosine Functions To graph y = a sin bx or y = a cos bx, with b > 0, • Find the period, Start at 0 on the x-axis, and lay off a distance of • Divide the interval into four equal parts. • Evaluate the function for each of the five x-values resulting from step 2. The points will be the maximum points, minimum points, and x-intercepts. • Plot the points found in step 3, and join them with a sinusoidal curve with amplitude |a|. • Draw additional cycles as needed.
5.5 Graphing y = a sin bx Example Graph y = –2 sin 3x. Solution • Period: • Divide the interval into four equal parts to get the x-values
5.5 Graphing y = a sin bx • Plot the points (x, –2 sin 3x) from the table. • Notice that when a is negative, the graph of y = –2 sin 3x is a reflection across the x-axis of the graph of y = |a| sin bx.
5.5 Translations • Horizontal • The graph of y = f(x – d) translates the graph of y = f(x) d units to the right if d > 0 and |d| units to the left if d < 0. • A horizontal translation is called a phase shift and the expression x – d is called the argument. • Vertical • The graph of y = c + f(x) translates the graph of y = f(x) c units upward if c > 0 and |c| units downward if c < 0.
5.5 Graphing y = c + a sin b(x – d) Example Graph y = –1 + 2 sin(4x + ). Solution Express y in the form c + a sin [b(x – d)]. Amplitude = 2 Period Translate |-1| = 1 unit downward and units to the left. Start the first period at x-value and end the first period at