Download
1 / 29
300 likes | 436 Vues
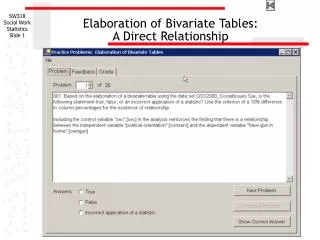
Crosstabs & Measures of Association. POL242 October 9 and 11, 2012 Jennifer Hove. Questions of Causality. Recall: Most causal thinking in social sciences is probabilistic, not deterministic: as X increases, the probability of Y increases, not that X invariably produces Y

E N D
Crosstabs & Measures of Association POL242 October 9 and 11, 2012 Jennifer Hove
Questions of Causality • Recall: • Most causal thinking in social sciences is probabilistic, not deterministic: as X increases, the probability of Y increases, not that X invariably produces Y • We can observe only association per Hume • We must therefore infer causation • Not one, but many possible causes
Inferring Causal Relations 1.There must be association • X Y; ~X ~Y 2. Time order must be considered • Presumed cause should precede presumed effect 3. Must rule out possible rival explanations • Sometimes what appears to be a strong relationship between two variables is due to influence of others 4. Must be able to identify the process by which one factor brings about change in another • Causal linkage
Establishing Association • With nominal or ordinal data, relationships usually presented in tabular or table form • Why? Hypotheses rest on core idea of comparison • Ex: if we compare respondents on basis of their value on the IV, say party identification, they should also differ along DV, say support for gay rights • Crosstabs are a wonderful means of making comparisons • “God speaks to you through crosstabs!”
Using/Interpreting Crosstabs • Data arranged in side-by-side frequency distributions • IV (X) presented across the top of the table – in columns • If ordinal, arrange from low scores (on left) to high scores (on right) • DV (Y) presented down the left hand side of the table – in rows • Again, if ordinal, arrange from low (at top) to high (at bottom)
Using/Interpreting Crosstabs • Data presented so that categories of the IV add to 100% • Percentaging within categories of the IV (down in a table) • Comparisons are made across categories of the IV • From left to right • To see the effect of the IV on the DV
Rules (!) of Crosstabs 1. Make the IV define the columns and the DV define the rows of the table 2. Always percentage down within categories of the IV 3. Interpret the relationship by comparing across columns, within rows of the table
Example: 2 x 2 Crosstab Support for Y Variable by Support for X Variable
Diagonals • Main diagonal: running to the right and down • When larger proportion of cases fall on main diagonal, relationship is said to be direct or positive • Low values on X associated with low values on Y; high values on X associated with high values on Y
Diagonals • Off diagonal: running to the right and up • When larger proportion of cases fall on off diagonal, relationship is said to be inverse or negative • Low values on X associated with high values on Y; high values on X associated with low values on Y
Explaining Variation in Y • Relationships between variables in social sciences are rarely, if ever, perfectly predictable • You are unlikely to see something like this: Support for Y Variable by Support for X Variable
Explaining Variation in Y • There is likely to be more than one explanation or “cause” behind the variation in Y • So we will generally be looking at: • X1 Y • X2 Y • To compare, we want to know relative strength of each relationship • A variety of summary terms called measures of association are used
Measures of Association • Compress information that appears in a crosstab into a single number by summarizing: • Magnitude (strength) of the relationship • Direction of the relationship • Magnitude: ranges from 0 (completely unpredictable) to 1 (perfectly predictable) • Direction: positive (+) = cases primarily on main diagonal; negative (-) = cases primarily on off diagonal
Two Cautionary Notes • Direction is not useful with nominal-level variables, since they are not ordered/ranked from low to high • Even with ordinal measurement, interpretation of direction depends entirely on how your variables are coded • Should always code your variables so that high scores indicate “more” of what you want to explain
Direction & Strength • Combining direction & strength, we get a range of possibilities • All intermediary values can also occur, e.g. -.2367 • Note that equivalent positive and negative scores are equal in strength • Ex: +.4 and -.4 are equal in strength; they differ only in direction
Choosing among Measures • We use different measures of association for 2 main reasons: 1. There are different levels of measurement • Ordinal measurement offers ranking information used to calculate association, which isn’t available with nominal data 2. Some measures are specific to tables of certain sizes and shapes • Specific measures for 2 x 2 tables; others for larger square tables; still others for rectangular tables
PhiΦ • Use with dichotomous variables, 2 x 2 tables • Applies to nominal and ordinal data • Measures the strength of a relationship by taking the # of cases on the main diagonal minus the # of cases on the off diagonal (adjusting for marginal distribution of cases, i.e. the sum of the columns and rows)
Cramer’s V • An extension of Phi • Logic of Cramer’s V is based on percentage differences across the columns, not on logic of diagonals • Use with nominal data, when tables are larger than 2 x 2
Lambda • Lambda (λ) is another measure of association for nominal data • Its rationale of “percentage of improvement” or “proportion reduction in error” is relatively easy to explain • Not recommended in this course • When modal category of each column is in same row, λ=0
Measures of Association: Ordinal Data • Measures include Tau-b, Tau-c and Gamma • Rely on analysis of diagonals
Measures of Association: Ordinal Data • Measures include Tau-b, Tau-c and Gamma • Rely on analysis of diagonals
Measures of Association: Ordinal Data • Measures include Tau-b, Tau-c and Gamma • Rely on analysis of diagonals
Mind your Ps and Qs • The letter P indicates the # of pairs of cases on the main diagonals (from left to right) • The letter Q indicates the # of pairs of cases on the off diagonal (from right to left) • If P > Q, we have a positive association • If P < Q, we have a negative association • The core calculation = P - Q
Gamma • The information of P and Q can be used to calculate Gamma (γ) • Problems: • Any vacant cell produces a score of 1.0 • Tends to overstate strength of a relationship
Tau-b and Tau-c • Preferable to Gamma, though built on the same logic of diagonals • Tends to produce results similar to phi (using nominal data) or the most important interval measure (r) – to be discussed later in the year
Tau-b and Tau-c • Tau-b never quite reaches 1.0 in non-square tables • So Tau-c was developed to use with rectangular tables • In practice, the difference between Tau-b and Tau-c when applied to the same table is not great, but keep the distinction above in mind
Example Tau-c: -.39 Tau-b: -.35 Source: Latinobarometer, 2007 – Venezuelan respondents only
Summing Up • With nominal data, use Phi or Cramer’s V • Phi used for 2 x 2 tables • Cramer’s V used for any other crosstab involving nominal data • Avoid Lambda • With ordinal data, use Tau-c or Tau-b • Tau-b used for square tables: 3 x 3, 4 x 4, etc • Tau-c used for rectangular tables • Avoid Gamma