Download
1 / 24
430 likes | 815 Vues
MEASURES OF VARIABILITY. Knowing the central value of a set of measurement tells us much, but it does not by any means give us the total pictures of the sample we have measured

E N D
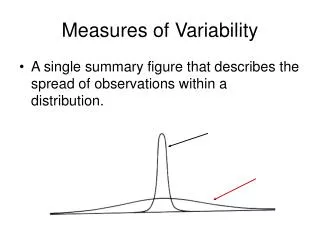
Knowing the central value of a set of measurement tells us much, but it does not by any means give us the total pictures of the sample we have measured • Two groups of six-year-old children may have the same average IQ of 105. One group contain no individuals with IQs below 95 or above 115, and that the other includes individuals with IQs ranging from 75 to 135 • We recognize immediately that there is a decided difference between the two groups in variability or dispersion
75 85 95 105 115 125 135 The BLUE group is decidedly more homogenous than the RED group with respect to IQ
Purpose of Measures of Variability • To explain and to illustrate the methods of indicating degree of variability or dispersion by the use of single numbers • The three customary values to indicate variability are • The total range • The semi-interquartile range Q, and • The standard deviation S
The TOTAL RANGE • The total range is the easiest and most quickly ascertained value, but it also the most unreliable • The BLUE group (from an IQ of 95 to one of 115) is 20 points. The range of RED group from 75 to 135, or 60 points • The range is given by the highest score minus the lowest score • The RED group has three times the range of the BLUE group
The SEMI-INTERQUARTILE RANGE Q • The Q is one-half the range of the middle 50 percent of the cases • First we find by interpolation the range of the middle 50 percent, or interquartile range, the divide this range into 2
Low Middle Quarter High Middle Quarter Lowest Quarter Highest Quarter Q3 Q1 Q2 Q2 – Q1 Q3 – Q2 Q3 – Q1 = 2Q Q3 – Q1 Q = 2
The STANDARD DEVIATION S • Standard deviation is by far the most commonly used indicator of degree of dispersion and is the most dependable estimate of the variability in the population from which the sample came • The S is a kind of average of all deviation from the mean ∑x2 S = √ N
As a general concept, the standard deviation is often symbolized by SD, but much more often by simply S • In verbal terms, a S is the square root of the arithmetic mean of the squared deviations of measurements from their means
Data Illustrating Sum of Squares, Variance, and Standard Deviation
∑x2 S = √ N Data Illustrating Sum of Squares, Variance, and Standard Deviation
∑x2 S = √ N Data Illustrating Sum of Squares, Variance, and Standard Deviation
∑x2 S = √ N Data Illustrating Standard Deviation 51,6 = √ 10 √ = 5,16 S = 2,27
∑fx2 S = √ N Computing a S in Grouped Data
∑fx2 S = √ N Computing a S in Grouped Data
∑fx2 S = √ N Computing a S in Grouped Data
∑fx2 S = √ N Computing a S in Grouped Data
∑fx2 S = √ N Computing a S in Grouped Data
Computing a S in Grouped Data ∑fx2 S = √ N 5462 = √ 50 √ = 109,24 S = 10.45
Interpretation of a Standard Deviation • The usual and most accepted interpretation of a S is in percentage of cases included within the range from one S below the mean to one S above the mean • In a normal distribution the range from -1σ to +1σ contains 68,27 percent of the cases • If the mean = 29,6 and S = 10,45; we say about two-third of the cases lies from 19,15 to 40,05
Interpretation of a Standard Deviation • One of the most common source of variance in statistical data is individual differences, where each measurement comes from a different person
Interpretation of a Standard Deviation • Giving a test of n items to a group of person Before the first item is given to the group, as far as any information from this test is concerned, the individuals are all alike. There is no variance • Now administer the first item to the group. Some pass it and some fail. Some now have score of 1, and some have scores of zero • There are two groups of individuals. There is much variation, this much variance
Interpretation of a Standard Deviation • Give a second item. Of those who passed the first, some will past the second and some will fail it. Etc. • There are now three possible scores : 0, 1, and 2. • More variance has been introduced • Carry the illustration further, adding item by item • The differences between scores will keep increasing, and also, by computation, the variance and variability
Another rough check is to compare the S obtained with the total range of measurement • In very large samples (N=500 or more) the S is about one-sixth of the total range • In other word, the total range is about six S • In smaller samples the ratio of range to S can be expected to be smaller (see Guilford p.71)