Download
1 / 114
1.16k likes | 1.4k Vues
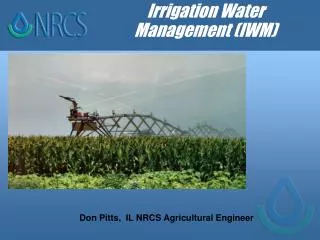
Irrigation Management Practices. Lyndon Kelley MSU Extension / Purdue University Irrigation Management Agent. WWW.msue.msu.edu - find St. Joseph Co. - then hit the Irrigation button.

E N D
IrrigationManagement Practices Lyndon Kelley MSU Extension / Purdue University Irrigation Management Agent WWW.msue.msu.edu - find St. Joseph Co. - then hit the Irrigation button Thanks to Dr. Ted Loudon - MSU Ag Engineering Dr. Ron Goldy - MSU Extension Dr. Jeff Andreasen – MSU Geography Dr. Steve Miller - MSU Ag Engineering
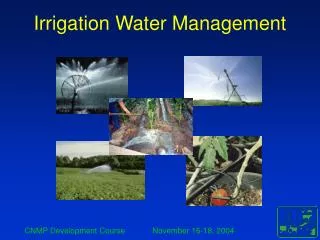
Tools for Irrigation Stewardship • Irrigation System Uniformity • Preventing Irrigation Runoff (comparing irrigation application rate to soil infiltration rate) • Irrigation Scheduling • Backflow protection • Avoiding water use conflicts • Record keeping
Irrigation power cost vary on: - power source - power cost - system pressure Average fuel cost for pumping NE. USA: 2006 Cost per acre inch of irrigation water
Day to Day Power Operation Costs Table 2. Comparative Costs of Various Energy Sources to Obtain Equal Work Output per Dollar Spent Source:AE-111 Comparable Costs of Various Energy Sources for Irrigation Pumping
Estimated rainfall recharge Scientific Investigations Report 2005–5284 U.S. Department of the Interior U.S. Geological Survey
Needed Irrigation 5.5” Normal rainfall 34.6 Crop need 15.6” total
Thirty years of Increasing Irrigation have not Impacted Municipal Water Well Depths
Have you seen yield map patterns that match the irrigation system configuration?
Irrigation System Uniformity -Options • Irrigator trainings (Extension, SCD, NRCS ) • Private consultants • SCD
Irrigation System Uniformity • An 1” application should be 1” everywhere in the irrigated field • 10% or less deviation from the average is ideal. • Over applied area will likely be over applied each • application • Under applied areas will likely be under applied each • application • A 30% deviation on a field in an 8” irrigation application year will have areas receiving as little as 5.6” and as great as 10.4” • Repair all visible system leaks and problems first.
Evaluating Irrigation System Uniformity Standards and Methods for Evaluation of Irrigation System Uniformity • Two commonly accepted standards or methods are available as guidelines for performing evaluations of Irrigation System Uniformity. • ASAE Standards (436.1) — Available at: http://www.kbs.msu.edu/mgsp/resources.htm • NRCS Handbook — Available at your local Natural Resource Conservation Service office or http://www.wcc.nrcs.usda.gov/nrcsirrig/irrig-handbooks-part652-chapter15.html
Irrigation System Uniformity Basic system evaluation Collect enough uniform container to to place every 10 feet the length of the system or across the application pattern. Spread the container every ten feet from the center point to the outside edge of the application area. Run the machine at standard setting over the container. Measure and record the water volume caught by each container Note sample point varying greater than 50% of the average.
Evaluating Irrigation Uniformity Catch can stands • A simple , inexpensive catch can stand can be built using: • 32 oz. Deposable soda cup (Taco Bell cup) • 3” plastic drain pipe cut to 5” in length • 2”x3” stud cut to length to wedge into plastic drain pipe • Drill hole 1.5” into cut 2”x3” stud chucks, drill hole should snuggly fit electric fence post • Steel ( step in ) electric fence post • Electric fence post and cups can be stored and transported in separate stacks. The 2”x3” stud chucks wedge into the base of the cut plastic drain pipe sections and make the transition between the cup and post. Screw maybe pace through the side of the plastic drain pipe into the 2”x3” stud chucks. • Total cost per unit is less than a dollar and require only a saw, drill and screw driver. It will allow data collection
Evaluating Irrigation System Uniformity Pivot Extensions (cornering arm or Z-arm) • Some center pivot irrigation systems are designed to expand the wetted area to allow coverage of corner or odd-shaped fields, often referred to as cornering arms or Z-arm. These systems require two separate evaluations if the extension accounts for 30 percent or more of the irrigated portion of the field. One evaluation will evaluate the system while extended, and a second when the arm is not deployed.
Overview of Evaluation of Irrigation System Uniformity Guidelines (center pivot) • Have the producer walk the system length and note any application problems while the system is applying water. All known application problems need to be corrected before doing an evaluation of Irrigation System Uniformity. • Have the producer start the system and establish a setting for his normal application (avoid weather extremes). • Run the system for 10 minutes or more without changes to water supply system. • Place catch cans in a line from the center pivot point past the outer edge of the wetted area. • Catch cans should be placed to form a straight line from the pivot point to a point on the outer edge of the wetted area. • Space catch cans 20 feet apart for system overhead impact sprinklers, and 10 feet apart for all other center pivot application systems. • Place catch cans with opening at a height above the crop, or in a field opening width four times greater than the height difference between the crop and catch can opening. • A drop of mineral oil may be added to each catch can to minimize evaporation if a reading cannot be taken immediately and conditions favoring evaporation are prevalent. • If the catch can placement falls into the wheel tracks, it may be moved one to two feet to avoid damage. • Record the number of catch cans placed, the producer’s intended application, catch can opening diameter and other pertinent information. A sample record sheet to use for data collection follows. • Record volume collected from each catch can (ml.). • Record the locations of pivot wheel lanes
Evaluation of Data Cleaning the Data • Catch can data from the first 10 percent of the system length closest to the center pivot point should be ignored. The “average catch can (ml)” data replaces the first catch can data points. The actual “distance from center point” is entered for the first data point (remaining after deletion of other points closer to the center pivot point). Coverage near the center point of the system represents such a small amount of the total system coverage deviation from the average, that it yields little effect on the machine’s overall uniformity. • Catch can data from the outer edge of the wetted area is deleted from the data set when the volume is less than 70 percent of the average. Removing the data that tails off at the outer edge of the system designates the effective irrigated area, and avoids dilution of the data points representing the actual targeted irrigated area. • Up to three percent of the data points should be removed if it is an extreme deviation from the average. This is done after the outer edge data has been removed to define the effective irrigated area and up to 20 percent of the inner area data has been removed. A few catch cans could collect extreme data that is not representative of the system area, like water running from a trust rod or brace rod directly to the cup.
System Uniformity Coefficient • System Uniformity Coefficient is a numeric judgment of the overall performance of an irrigation system’s ability to evenly apply water to the field. • A System Uniformity Coefficient of 85 percent or greater, is considered not to need major adjustments to the sprinkler package, although individual sections of the irrigator may benefit from corrections (green or black in the spreadsheet). • System Uniformity Coefficient of 80 to 85 percent may need further analysis of the sprinkler package, and individual sections of the irrigator would benefit from corrections (yellow in the spreadsheet). • System Uniformity Coefficient of less than 80 percent requires an adjustment to the sprinkler package design and correction of individual sections of the sprinkler package (red in the spreadsheet).
2640’ Field #9
2640’ Field #9
2640’ Field #9
Creating a Take-home Message for the Producer The System Uniformity Coefficient provides the producer with a report of the overall performance of the system. Almost all systems will benefit from some corrections. Correction of areas of the system with greater than 20 percent deviation from average (red in the spreadsheet) will improve performance. Entering a second data set, replacing the red (high deviation) data with the “average catch can (ml)” data, will create a before/after scenario that will identify the benefits of repairs or corrections to the system. Graph of performance The Excel spreadsheet can produce a line graph of systems uniformity. The data will not be weighted for coverage area represented by each cup. Entering pivot wheel tracks into the graph using Microsoft standard AutoShape will make the graph more usable to irrigators.
Sprinkler overlap with end gun Tower 1 Tower 3 Tower 5 Tower 7 Tower 8 http://web1.msue.msu.edu/stjoseph/anr/anr.htm
Irrigation System Uniformity • Most system are designed to have 90% or better uniformity • Changes in volume and pressure from design parameters will cause reduction in uniformity • Some sprinklers can perform well over a large change in pressure over others • Multiple overlaps tends to reduce potential problems
Greatest improvement needed • End gun stop adjustment • Water supply over or under design • End gun orifice, too little or too much • Wrong sprinkler or tip • Leaks, plugs and no turn sprinklers
Water supply over or under designsupply over design yield tail up,supply under design yield tail downExample of Water supply under volume for sprinkler design
Sprinkler overlap with end gun Tower 1 Tower 2 Tower 3
Total Acres 126acres 96 acres 71 acres 49 acres 31 acres 18 acres 2 acres 2072’ 3109’ 30 acres 25 acres 22 acres 13 acres 10 acres 18 acres 4145’ 330’ 5181’ 495’ 6217’ 7253’ 660’ 8290’ circumference 990’ Over and under application issue affect the majority of the application area 8 acres 6 acres 165’ 825’ 1155’ 1320’ Feet from center
Most system apply within 85% of the expected application Application is 4 % under expectation
Measure flow at desired pressure prior to ordering sprinkler package Poor performance: Ask dealer to measure flow at peak water use season and compare to design parameters.
Preventing Irrigation Runoff(comparing irrigation application rate to soil infiltration rate)
Preventing Irrigation Runoff(comparing irrigation application rate to soil infiltration rate) • Sprinkler package or nozzle selection along with pressure dictates water application rate . • Factors that increase runoff : • Small Wetted area or throw of sprinkler • Low Pressure • Larger applications volumes • Soil compaction • Heavy soils • Slope • Row hilling
Instructions for completing the Evaluating Potential Irrigation Runoff form : • Identify the areas of the irrigated field that has the lowest infiltration rates. (heavy soils, slopes, surface compaction). • Select a transit line in the wetted area just behind the machine that covers the identified lowest infiltration rates of the field identified above.
Instructions for completing the Evaluating Potential Irrigation Runoff form – continued • Pace or measure 50 feet between observations starting at the pivot point and progressing to the furthest reaches of the machine. • Record observations for each location; look at several (4-5 areas) representing the row contour and differences in row traffic of the location. Record any specific concerns that may affect the application (drips or leaks) or affect the soils ability to take in water (compaction, row contours) Key for Observation column A- no observed puddling, ponding or sheen between rows B- puddling, ponding or sheen between rows identified, but no observed runoff or flow of water C-observed runoff or flow of water
Calculating Instantaneous Application Rate • Flag the leading edge of the wetted area just inside of the last tower of the pivot. • Running the pivot at common speed with a measured and known application rate. • Using a stop watch measure the time elapsed from the first drops hitting the flag till the last. • Divide the measured and known application rate for the spot by the time elapsed. • Convert to Minute to provide 1 inch application.
Instantaneous Application Rate • Time it from first drop of irrigation to last • Divide by know application rate • Convert to minute to provide 1” of irrigation
Instantaneous Application Rate John applied .75 inches in 21 minute .75 inches=1.00 inches 21 min. ? = 28 min./inch
The Goal • Apply a consistent uniform amount of water over the whole field. • Apply water at a rate (volume/time ) that can infiltrate into soil avoiding runoff. • Avoid water loss to air or off target.
The larger the wetted area the slower the rate of application. Average 1’ rainfall comes over 4 hours. An 1’ rainfall over an hour is considered a “Toad strangler” Sprinkler packages are commonly available with instantaneous application rates from 1” per 12 minutes to 1” per 80 minutes
Preventing Irrigation Runoff(comparing irrigation application rate to soil infiltration rate) • Management factors that increase runoff: • Larger applications volumes • Soil compaction • Heavy soils • Slope • Row hilling
Irrigation System Uniformity • Sprinkler package or nozzle selection along with pressure dictates water application rate . • Factors that increase runoff: • Small wetted area or throw of sprinkler • Low Pressure
Total Acres 126acres 96 acres 71 acres 49 acres 31 acres 18 acres 2 acres 2072’ 3109’ 30 acres 25 acres 22 acres 13 acres 10 acres 18 acres 4145’ 330’ 5181’ 495’ 6217’ 7253’ 660’ 8290’ circumference 990’ Instantaneous application rate 8 acres 3 days / circle @ 1” 3 days = 4320 min. 8290’ / 4320 min.= = 1.92’/minute 20’ ft. wetted area= = 1” / 10.4 Minutes 40’ ft. wetted area= = 1” / 20.8 Minutes 6 acres 165’ 825’ 1155’ 1320’ Feet from center