Download
1 / 76
770 likes | 1.37k Vues
Wisconsin Knowledge and Concepts Examination And ACCESS for ELLs Post-Test Workshops May 5, 2009 May 7, 2009 Purpose of the Post-Test Workshops Understanding, Interpreting and Explaining 2008-09 WKCE/WAA Test Results Accessing WKCE Reports Using WSAS On-line Reporting System (Turnleaf)

E N D
Wisconsin Knowledge and Concepts Examination And ACCESS for ELLs • Post-Test Workshops • May 5, 2009 • May 7, 2009
Purpose of the Post-Test Workshops • Understanding, Interpreting and Explaining 2008-09 WKCE/WAA Test Results • Accessing WKCE Reports Using WSAS On-line Reporting System (Turnleaf) • Adequate Yearly Progress (AYP) • ACCESS for ELLs • Looking Ahead to Fall 2009
Understanding,Interpreting,andExplaining 2008-09 WKCE/WAA Test Results
WKCE/WAA Reports • Individual Profile Report (IPR) • School Record Sheet • Proficiency Summary • Item Response Analysis • Item Analysis Summary by Standard • Standards Performance Summary • Scale Score Summary • Extended Writing Sample by Rubric & Student Group • 1 & 2 Year Growths • Longitudinal Data- Individual Students
Individual Profile Report (IPR) (sample in your binder) • Printed on paper; not available through Turnleaf On-line Reporting System • Buildings received two copies for each student (February 2009): • One copy for the school (cum folder) • One copy for the parent/guardian • Students who took the Wisconsin Alternate Assessments received a separate IPR
WKCE - Individual Profile Report (IPR) Student’s Score State Percentile Score Student’s Range of scores Writing Scores Framework/Standard
WAA - Individual Profile Report (IPR) Total Points Possible Student’s Score Cut Scores Framework/Standard Percent correct
School Record Sheet - WKCE State District School Student results in alpha order
School Record Sheet – WAA SwDis State Average District Average School Average Total Points Possible Student results in alpha order
School Proficiency Summary – WKCE/WAA Breakdown by Demographic Groups Unshaded boxes in each row add to 100%
Item Response Analysis – Selected Response (SR) Percent choosing each optional answer Correct answer checked Percent Correct Depth of Knowledge Item number
Item Response Analysis – Constructed Response (CR) Average points awarded Percent of students scoring at each point value Possible points
Item Analysis Summary by Standard Possible points and average points awarded (for each framework/standard) Demographic groups
Standards Performance Summary Standards Performance Index by Framework/Standard A Standards Performance Index (SPI) is an estimate of the number of questions that a student could be expected to answer correctly if there had been 100 questions measuring that content standard on the test. The average SPI is the mean of the SPIs for students tested in that standard. Demographic groups
Scale Score Summary Average scale score for each group Demographic groups
Extended Writing Sample by Rubric Frequency distribution of points awarded Type of score Average points awarded by group Points possible
Extended Writing Sample by Student Group Distribution of awarded points Demographic groups
1 Year Scale Score Growth by Student (Change in Scale Score from 2007-08 to 2008-09) Demographic data Demographic data Change in scale score Proficiency level/Scale Score
2 Year Scale Score Growth by Student (Change in Scale Score from 2006-07 to 2008-09) Demographic data Change in scale score Proficiency level/Scale Score
Longitudinal Data – Individual Student Grade/proficiency level/scale score by content area and SPI by framework/standard for 2006-07, 2007-08, 2008-09
Scale Score Continuum LineReading Gr 3 270 394 430 466 640 B P A 280 396 440 489 650 Gr 4 B P A 290 401 444 497 690 Gr 5 B P A 300 418 457 514 730 Gr 6 B P A 310 434 467 523 780 Gr 7 B P A 330 445 480 539 790 Gr 8 B P A 350 456 503 555 820 Gr 10 B P A B = Basic P = Proficient A = Advanced
Scale Score Continuum LineMath Gr 3 220 630 392 407 452 A P B 240 421 438 484 650 Gr 4 B P A 270 445 463 505 680 Gr 5 B P A 310 464 485 532 700 Gr 6 B P A 330 480 504 555 710 Gr 7 B P A 350 483 513 573 730 Gr 8 B P A 410 516 541 595 750 Gr 10 B P A B = Basic P = Proficient A = Advanced
WSAS On-Line Reporting System http://wsasors.turnleaf.com (on-line Turnleaf Training)
Adequate Yearly Progress (AYP)
Determining AYP: 2008-09 Schools & districts must meet criteria for four AYP objectives: 95% of total # of students enrolled in the tested grades Test Participation 74% Proficiency Index (FAY) Reading Mathematics 58% Proficiency Index (FAY) Other Indicator 90% of statewide average or growth: 80% graduation or 85% attendance (Attendance/graduation)
2008-09 AYP Notification • Only districts/schools that are in one or more of the following four categories will be notified in writing of their preliminary AYP status by May 22, 2009: • missed AYP for 2008-09, or • are identified for improvement at the school or district (SIFI or DIFI), or • missed AYP in 2007-08 and have now met AYP in all areas, or • were identified for improvement previously and are now in satisfactory status.
100 3-8 testing began 2005-06 80 61% 60 Accelerated annual gains beginning 2010-11 40 20 0 Determining AYP: Annual Measurable Objectives (AMOs) Required Proficiency by 2013-14= 100% 74% 67.5% 58% 47.5% % Proficient/Advanced 37% Reading Mathematics 2012-13 2013-14 2011-12 2010-11 2001-02 2009-10 2002-03 2003-04 2004-05 2005-06 2006-07 2007-08 2008-09
Annual Measurable Objectives (AMO) READING MATHEMATICS Starting Point 2001-02 61% 37% 2002-03 61% 37% 2003-04 61% 37% Intermediate Goal 2004-05 67.5% 47.5% (Begin new 3-8 tests) 2005-06 67.5% 47.5% 2006-07 67.5% 47.5% Intermediate Goal 2007-08 74% 58% 2008-09 74% 58% 2009-10 74% 58% Intermediate Goal 2010-11 80.5% 68.5% Intermediate Goal 2011-12 87% 79% Intermediate Goal 2012-13 93.5% 89.5% Goal: All Proficient 2013-14 100% 100% Annual Measurable Objectives for Reading and Mathematics 2002-03 through 2013-14 PERCENT OF WI STUDENTS WHO NEED TO SCORE AT PROFICIENT/ADVANCED
Growth and AYP Some states are beginning to use growth models as part of calculating AYP. • WI will be eligible beginning 2008-09. • Research studies are under way to explore how our data works with different approaches to growth modeling. • Currently approvable growth models used by some states do not produce significantly different results from the current status approach of NCLB. • WI is exploring multiple approaches to growth to prepare for potential broader options that might be allowable pending any changes that could come with NCLB reauthorization.
Public Release of Data • Public release of WSAS data was April 28, 2009 • WINSS has been updated
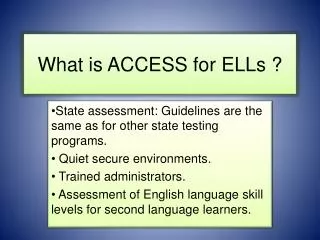
The Purpose of ACCESS for ELLs • Monitor student progress in English Language Proficiency on a yearly basis (NCLB) • Serve as a criterion when English Language Learners have attained full language proficiency
The Levels of English Language Proficiency 5 BRIDGING 4 EXPANDING 3 DEVELOPING 2 BEGINNING 1 Formerly LEP ENTERING 6 Never LEP 7
ACCESS for ELLs • 40 KUSD schools participated in testing • 2,025 students were tested • 1,253 in elementary • 424 in middle school • 348 in high school • ELL students in KUSD represent nearly 40 different languages • Approximately 90% Spanish
ACCESS for ELLs • Assessment in each of the four language domains: • Listening – multiple choice • Reading – multiple choice • Speaking – individually administered, scored with speaking rubric • Writing – group administered, scored with writing rubric
ACCESS for ELLs Scores • Raw Scores • Scale Scores • Proficiency Levels
Raw Scores • Listening and Reading • Based on number of correct items • Speaking • Based on number of tasks met • Writing • Based on points received in three components of writing rubric
Scale Scores • Allows scores across grades and tiers to be compared on a single scale • Each language domain has a separate scale • Scale scores range from 100 to 600
Proficiency Levels • Interpretive scores (based on scale scores) • Range from 1.0 to 6.0 • Whole number indicates level • (1=entering, 2=beginning, etc.) • Decimal indicates proportion within proficiency level • 1.5 is half way through Level 1 (Entering)
Proficiency Levels • Cut scores are based on grade level. No changes from last year. • 2005-06 cut scores are different because they were based on grade cluster. • Each language domain has separate cut scores.
Composite Scores • Oral Language • 50% Listening + 50% Speaking • Literacy • 50% Reading + 50% Writing • Comprehension • 70% Reading +30% Listening • Overall • 35% Reading + 35% Writing + 15 % Listening + 15% Speaking
Confidence Bands • Represents Standard Error of Measurement (SEM) of scale score • Illustrates a student’s possible range of language proficiency based on his test score with a 95% probability of accuracy