Download
1 / 30
300 likes | 307 Vues
Monitoring Vegetation Health. Research Question Can affordable “Plant Stress Glasses” (i.e., green-subtracting filters) enable Forest Watch students to visualize and quantify different levels of vegetation stress?. General Procedure

E N D
Monitoring Vegetation Health Research Question Can affordable “Plant Stress Glasses” (i.e., green-subtracting filters) enable Forest Watchstudents to visualize and quantify different levels of vegetation stress? General Procedure Simulate “Plant Stress Glasses” by placing comparable green-subtracting filter material over digital camera lens, followed by comparison of digital output from camera and VIRIS (Visible InfraRed Intelligent Spectrometer; GER2600).
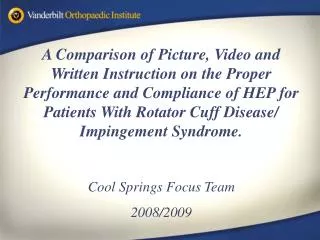
Objective- Determine if minus green filter material could enable students to visually detect vegetation stress spectral properties. • Use natural and induced vegetation stress to initiate spectral reflectance changes in vegetation. • Use VIRIS to quantify stress induced spectral reflectance changes. • Use a commercially available digital camera, a photographic gray scale, and minus green filter to quantify stress induced spectral reflectance changes. • Compare digital camera/filter spectral response to VIRIS spectral response. Here we assume the VIRIS spectral response represents ‘truth’ or ‘spectral reality’, and the degree to which the digital camera/filter reproduces the VIRIS spectral response is assumed to be a direct indicator of its ability to represent ‘spectral reality’.
Methodology • Use gradual stressors as treatments for plant foliage: 1) seasonal (phenological) change, and 2) drying of cut foliage. • Measure spectral reflectance properties simultaneously with the VIRIS and with a digital camera outfitted with minus green filter (theater gel). • Hypothesis 1: There is a statistically significant association between the VIRIS and digital camera/filter measurements. Using VIRIS ($75,000.00 tool) to represent “spectral reality”, if the digital camera/filter ($300.00 tool) can not sufficiently estimate “spectral reality” then Hypothesis 1 is rejected. • Hypothesis 2: Vegetation determined to be stressed by the VIRIS will also be determined to be stressed by the digital camera. If this hypothesis is supported, then students can reliably use a digital camera to estimate vegetation stress.
Methodology continued Seasonal Vegetation Stress Leaf collections were made every 1-2 weeks from mid-June through mid-October; black birch, red maple, red oak, and white pine (5 sets of leaves per species). Leaves were photographed in the field under ambient lighting conditions with a digital camera at nadir, and a digital gray card in the field of view. Photos taken included no-filter, 1-layer filter, 2-layer (double) filter, and filter glasses. Leaves were placed in Zip-lock bags in cooler with blue-ice, transported to UNH, and refrigerated until scanned with the VIRIS. Samples were scanned with the VIRIS, and simultaneously digitally photographed, including no-filter, 1-layer filter, 2-layer (double) filter, and filter glasses. A digital gray card was in the field of view.
Methodology continued Using the digital photo processing software developed by John Pickle, blue and red channel radiance values were retrieved from a polygon on the leaf. Also using the software, the blue and red channel radiance values were retrieved from a polygon on the graycard from a location immediately adjacent to the leaf. Graycards use materials that reflect 30% of the incident radiation in all wavelengths. Photo of a red maple leaf-stack with gray scale in the picture
VIRIS Camera 1 with filter Camera 2 without filter Light Source
5 7 4 1 2 3
5 7 4 1 2 3
Dominant factors affecting leaf reflectance Leaf pigments Cell structure Water content Lignin and Tannins Healthy Red Edge Water absorption Damaged Cellulose peak Visiblespectrum (400-700 nm) Near Infrared (700–1000 nm) Spectral Data based on reflectance: Short Wave Infrared (1000-2500 nm) Shortwave Infrared (1000-2500 nm)
Spectral Indices Used • Red Edge Inflection Point (REIP) – A measure of the relative amount of chlorophyll, sensitive to initial loss of chlorophyll (Rock, et al., 1988). • Moisture Stress Index (MSI or TM 5/4) – A measure of foliar moisture content using two IR spectral bands (NIR and SWIR; Rock, et al., 1986). • Chlorophyll Minimum (Chlmin) – Percent reflectance at center of red chlorophyll well, indicative of major chlorophyll loss.
TM3 TM1 TM2 Filter Behavior (nm)
TM3 TM1 TM2 Gray Card Behavior (nm)
REIP vs. Day REIP Summary: Stable over entire period for White Pine (orange). Stable over most of period for Red Oak (green); declining around late September. Began to decline by late July and fell drastically in early September for both Black Birch (blue) and Red Maple (red).
Chlorophyll minimum Summary: Increased gradually over time up until late September for all species. By mid-October, Black Birch (blue) and Red Maple (red) exhibited dramatic increase, while Red Oak (green) increased a only slightly. White pine (orange) showed no dramatic changes in chlmin. Chlmin vs. Day Chlmin vs. Day
Pairwise Comparisons (correlations) between BLUE spectral reflectance acquired from Field Images, Lab Images, and VIRIS data. Black Birch Field Image/Lab Image Field Image/VIRIS Lab Image/VIRIS r -0.40 0.12 0.20 Red Maple Field Image/Lab Image Field Image/VIRIS Lab Image/VIRIS r -0.03 -0.28 0.02 Red Oak Field Image/Lab Image Field Image/VIRIS Lab Image/VIRIS r 0.03 -0.51 -0.45
Pairwise Comparisons (correlations; r) between RED spectral reflectance acquired from Field Images, Lab Images, and VIRIS data. Black Birch Field Image/Lab Image Field Image/VIRIS Lab Image/VIRIS r 0.70* 0.90*** 0.73* Red Maple Field Image/Lab Image Field Image/VIRIS Lab Image/VIRIS r 0.76* 0.91*** 0.68* Red Oak Field Image/Lab Image Field Image/VIRIS Lab Image/VIRIS r 0.42 -0.11 -0.32 *p<0.05, **p<0.01, ***p<0.001
Summary of Lab and Field Image comparisons with VIRIS • Blue channel is highly variable and shows no correlation between camera/filter images and VIRIS measurements. • Red channel shows much stronger correlation between camera/filter images and VIRIS measurements. However, this finding on applies to Black Birch, and Red Maple. In Red Oak, the red channel information from the images and VIRIS were unrelated. • Calibrated reflectances from the red channel of a digital camera outfitted with a green-subtracting filter shows greatest potential for assessing chlorophyll status, because its values are strongly associated with VIRIS measurements from the red region. This may not be the case, however, in all species.
How well associated are camera blue and red features with VIRIS REIP and Chlmin? Blue Red REIP REIP *p<0.05, **p<0.01, ***p<0.001 Blue Red Chlmin Chlmin
Summary of comparisons between camera/filter reflectance values and VIRIS REIP and Chlmin indices. • There were no pairwise comparisons between the blue reflectance values from the lab or field images and the VIRIS indices REIP and Chlmin that was statistically significant. This suggests the blue channel holds no predictive value for estimating REIP or Chlmin values. • Red information from images taken in the field showed good predictive potential for estimating REIP and especially good for Chlmin values in Black Birch and Red Maple, but not in Red Oak. • Red information from images taken in the lab showed good predictive potential for estimating Chlmin, but not REIP in Black Birch and Red Maple. Again, Red Oak Chlmin and REIP were not able to be predicted. • These findings suggest that camera/filter images acquired under similar or consistent lighting conditions may be useful in discerning “Plant Stress”, but those taken under field conditions may be far superior.
The Drying Experiment • Stack of Norway Maple and Red Oak Leaves Placed on Scale (to determine weight/water loss; • VIRIS Spectral Scan and Photos (with and without filters) taken every 15 minutes; • Change-over-time characterized for both the spectral (VIRIS) properties and the filter brightness values in the blue and red spectral regions.
Leaf Drying Stress- Norway Maple Mass vs. Time REIP vs. Time TM5/4 vs. Time NDVI vs. Time
Summary of findings from Norway Maple Drying Experiment • With drying, the expected results were observed in measurements of decreasing mass and increasing moisture stress index. • Unexpected results were observed in the form of substantial blue-shifts of the REIP during drying. • The digital camera/filter data and VIRIS measurements were in close agreement, suggesting that the minus green filter material can be useful for detecting drying stress over relatively short time frames.
Leaf Drying Stress- Red Oak (no mass measurements) REIP vs. Time NDVI vs. Time TM 5/4 vs. Time Chlmin vs. Time
Summary of results from Red Oak leaf drying experiments • Unlike Norway Maple, Red Oak demonstrated a resistance to changing spectral properties for the first 4 hours (250min). After 4 hours, there was more marked changes in NDVI, REIP, Chlmin, and the blue and red reflectance measurements. The MSI indicated water loss was occurring steadily from the onset of drying. • The camera with filter, was not able to reliable discern changes in blue and red reflectance throughout the drying experiment. As in the seasonal results, it appears that the camera and filter photography does not permit vegetation health assessment of drying Red Oak leaves.
Overall Summary of Results The VIRIS produced data consistent with vegetation stress for leaves undergoing seasonal change as well as experimental drying. In Black Birch and Red Maple, the digital camera/filter data produced data in close agreement with the VIRIS data. Thus the digital cameral/minus green filter has potential as an inexpensive, and accessible tool for students to estimate vegetation stress. Digital camera/filter blue channel data provided no information value for estimating stress under any circumstance, while red showed very good correspondence with VIRIS measurements.
Chlorotic Mottle Stomatal Rows
5th Annual GISDay November 17, 2004
Highest Level of Microcystin Toxic Algal Bloom Glasses?