Download
1 / 68
680 likes | 806 Vues
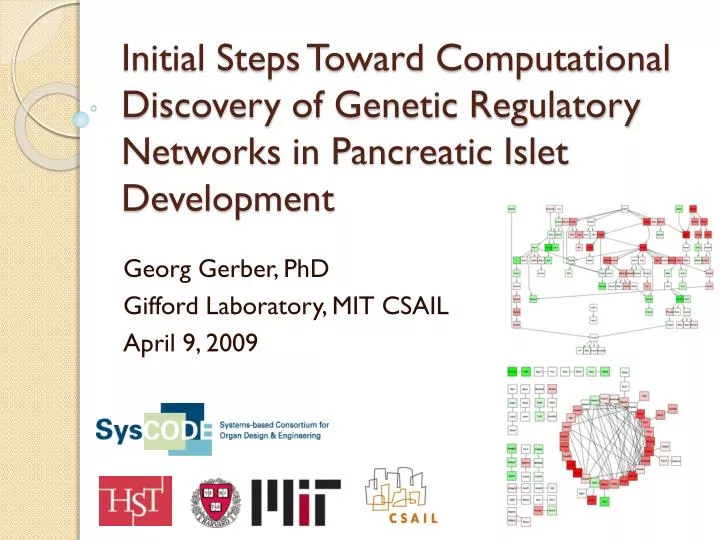
Initial Steps Toward Computational Discovery of Genetic Regulatory Networks in Pancreatic Islet Development. Georg Gerber, PhD Gifford Laboratory, MIT CSAIL April 9, 2009. Outline. Goals Expression data overview TF-TF interaction networks p air-wise mutual information Bayesian networks

E N D
Initial Steps Toward Computational Discovery of Genetic Regulatory Networks in Pancreatic Islet Development Georg Gerber, PhD Gifford Laboratory, MIT CSAIL April 9, 2009
Outline • Goals • Expression data overview • TF-TF interaction networks • pair-wise mutual information • Bayesian networks • Gene expression programs • ChIP-seq data • Directions for future work
Biological goals of building a transcriptional regulatory network of pancreatic specification • Knowledge of distinct signaling/transcriptional steps involved in pancreatic specification • Optimize ES differentiation by determining signaling event(s) directly inducing each sequential TF • What is the network structure? Linear or cross-regulatory, parallel or all interrelated • Direct reprogramming using TFs would benefit from knowing hierarchy of each network • Are TFs that play role in specification of pancreas necessary for later function of pancreas or are they merely required to properly induce other necessary TFs? • Can knowledge of the pancreatic specification network teach us about lineage diversification within the pancreas (endocrine, exocrine, duct)?
Immediate computational goals • Determine set of transcription factors active at different developmental stages • Discover network “wiring” • Determine how network changes/evolves throughout development • Compare in vivo and ESC networks
Outline • Goals • Expression data overview • TF-TF interaction networks • pair-wise mutual information • Bayesian networks • Gene expression programs • ChIP-seq data • Directions for future work
Expression data overview E8.25 Embryonic ectoderm/notochord Embryonic mesoderm Definitive endoderm (E7.75 and E8.75 as well) E11.5 Stomach endoderm Intestinal endoderm Pancreatic Endoderm (E10.5 as well) Lung endoderm Liver endoderm Esophageal endoderm
Tcf2 Foxa2 DMSO DMSO/ 2 uM RA 6h/24h 50 ng/mLActA 6 days ES Sox17 GFP+ FACS sort Sox17GFP+Dpp4- definitive endoderm and perform microarray 2 uM RA • Implant bead coated with DMSO/RA into foregut of E8.25 (4-6 somite) embryo • Explant embryo anterior to 1stsomite • Culture for 6/24 hours • Dissociate, sort for EpCAM+ endoderm • Amplify RNA and profile on Illumina Mouse Ref8 v2 chips
Expression data overview (cont.) • 120 Illumina arrays (18118 genes/array) • 72 distinct experiments (41 in mESC’s) • Standardized mESC/in vivo experiments separately • 2758 genes w/ ≥ 2-fold change in ≥ 5 experiments • 154 TFs w/ ≥ 2-fold change in ≥ 5 experiments (out of 946 “definite” or “candidate” TFs from TFCat, Fulton et al, Genome Biology 2009)
Limitations of expression data for genetic network reconstruction • Need 100’s of varied experiments for finding relevant/significant networks • Association ≠ causation • High false positive rates (high dimensional, noisy, dependent data) • High false negative rates (low TF transcript abundance, post-transcriptional regulation, etc.)
Outline • Goals • Expression data overview • TF-TF interaction networks • pair-wise mutual information • Bayesian networks • Gene expression programs • ChIP-seq data • Directions for future work
Pair-wise mutual information networks (CLR) • Context Likelihood of Relatedness method: Faith et al., PLoS Biology 2007 • Computes MI between all genes • Innovation: considers MI distribution for both target and source to compute p-values/estimate FDR
TF-TF network (MI) E8.25 4-6s definitive endoderm
TF-TF network (MI) E8.75 13-15s definitive endoderm
TF-TF network (MI) E9.5 definitive endoderm
TF-TF network (MI) E10.5 pancreatic endoderm
TF-TF network (MI) E11.5 pancreatic endoderm
TF-TF network (MI) E11.5 intestinal endoderm
TF-TF network (MI) 6h 83 uM RA bead mES 2 uM RA 6h
TF-TF network (MI) 24h 83 uM RA bead mES 2 uM RA 24h
Outline • Goals • Expression data overview • TF-TF interaction networks • pair-wise mutual information • Bayesian networks • Gene expression programs • ChIP-seq data • Directions for future work
Bayesian networks • Directed networks, allow for multiple parents • Encode conditional independence • Penalize complexity automatically • Software: Banjo (Alexander Hartemink, Duke University)
E8.25 4-6s definitive endoderm TF-TF network (Bayes Net)
E8.75 13-15s definitive endoderm TF-TF network (Bayes Net)
E9.5 definitive endoderm TF-TF network (Bayes Net)
E10.5 pancreatic endoderm TF-TF network (Bayes Net)
E11.5 pancreatic endoderm TF-TF network (Bayes Net)
mES 2 uM RA 6h 6h 83 uM RA bead TF-TF network (Bayes Net)
mES 2 uM RA 24h 24h 83 uM RA bead TF-TF network (Bayes Net)
Outline • Goals • Expression data overview • TF-TF interaction networks • pair-wise mutual information • Bayesian networks • Gene expression programs • ChIP-seq data • Directions for future work
Advantages to methods that discover groups of genes • Infer more robust relationships because considering many genes • Allow for enrichment analysis • Functional categories • Signaling pathways • TF DNA binding sequence motifs
GeneProgram • Gerber et al, PLoS Comp Bio 2007 • Discovers sets of genes co-expressed across subsets of conditions • Innovations: • Simultaneously models probabilistic structure of experiments (tissues) and genes • Uses Hierarchical Dirichlet Processes, a fully Bayesian method for automatically determining the number of expression programs and tissue groups • Outperforms state-of-the-art biclustering methods
Hierarchical clustering Singular Value Decomposition (SVD) Non-negative Matrix Factorization (NMF) GeneProgram w/o tissue groups Full GeneProgram model
tissue groups GeneProgram produced a map of 12 tissue groups and 62 expression programs
tissue GeneProgram produced a map of 12 tissue groups and 62 expression programs
GeneProgram produced a map of 12 tissue groups and 62 expression programs expression programs (sorted by generality score)
GeneProgram produced a map of 12 tissue groups and 62 expression programs expression program use by tissue
Expression program enrichment analysis • GO categories • FDR controlled to 5% • TRANSFAC motifs • Software: SAMBA • Scans +3000 to -200 bp for each motif • Uses PWM to score region, background to calculate p-value (Bonferroni corrected)
Expression programs (GO and motif enrichment) E8.25 4-6s definitive endoderm
Expression programs (GO and motif enrichment) E8.75 13-15s definitive endoderm
Expression programs (GO and motif enrichment) E9.5 definitive endoderm
Expression programs (GO and motif enrichment) E10.5 pancreatic endoderm
Expression programs showing TFs in programs and motif enrichment E8.25 4-6s definitive endoderm
Expression programs showing TFs in programs and motif enrichment E8.75 13-15s definitive endoderm
Expression programs showing TFs in programs and motif enrichment E9.5 definitive endoderm
Expression programs showing TFs in programs and motif enrichment E10.5 pancreatic endoderm
Expression programs showing TFs in programs and motif enrichment E11.5 pancreatic endoderm
Outline • Goals • Expression data overview • TF-TF interaction networks • pair-wise mutual information • Bayesian networks • Gene expression programs • ChIP-seq data • Directions for future work
Retinoic acid receptor ChIP-seq data • Generated in the Wichterle lab at Columbia (unpublished data, Motor Neuron Development Project) • mESC’s grown to embryoid body stage, profiled after 8h of RA exposure