Download
1 / 17
340 likes | 669 Vues
Chapter_Seventeen Correlation & Regression Analysis. Naresh K. Malhotra Marketing Research-an applied orientation , 4 th ed. Product moment correlation.

E N D
Chapter_Seventeen Correlation & Regression Analysis Naresh K. Malhotra Marketing Research-an applied orientation, 4th ed.
Product moment correlation Product moment correlation is a statistic is used to summarize the strength of association between two metric (interval or ratio) variables say X and Y. It is also known as Pearson Correlation Co-efficient, Simple Correlation, Bivariate Correlation or simply Correlation Co-efficient. It is proposed by Karl Pearson. Ex: How strongly are sales related to advertising expenditures? Formula: The value of r varies between -1 and +1. The value of r is equal- • 0 means there is no linear relationship between X and Y • 1 means there is a positive strong relationship between X and Y • -1 means there is a negative strong relationship between X and Y
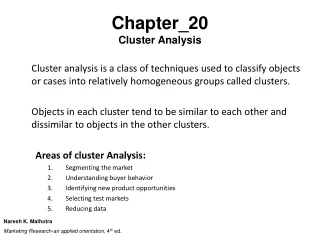
Regression Analysis Regression analysis is a powerful and flexible procedure for analyzing associative relationships between a metric dependent variable and one or more independent variables. It is concerned with the nature and degree of association between variables and does not imply or assume any causality. It is used in the following ways: Determine whether the independent variables explain a significant variation in the dependent variable: Whether a relationship exists Determine how much of the variation in the dependent variable can be explained by the independent variables: Strength of the relationship Determine the structure or form of the relationship: The mathematical equation relating the independent and dependent variables Predict the values of the dependent variable Construct for other independent variables where evaluating the contributions of a specific variable or set of variables.
Bivariate Regression Bivariate regression is a procedure for deriving a mathematical relationship in the form of an equation between a single metric dependent or criterion variable and a single metric independent or predictor variable. Ex: Can the variation in market share be accounted for by the size of the sales force? Equation:
Bivariate Regression’s process It is a nine-step process- Plot the Scatter Diagram Formulate the general model Estimate the parameters Estimate the standardized regression coefficient Test for significance Determine the strength & significance of association Check prediction accuracy Examine the residuals Cross validate the model
Multiple Regression Multiple regression involves a single dependent variable and two or more independent variables. Ex: Can variation in sales be explained in terms of variation in advertising expenditures, prices and level of distribution? The general form of the multiple regression model: which is estimated by the following equation:
Multiple Regression Process • The steps involved in conducting multiple regression analysis are similar to those for bivariate regression analysis. The discussion focuses on-