Download
1 / 55
550 likes | 669 Vues
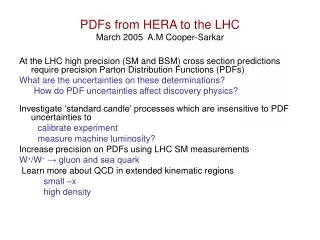
Legacy of HERA A M Cooper-Sarkar INT 10-3 October 18 2010. Combination of ZEUS and H1 data and PDF fits to these data: Inclusive cross-sections HERA-1 (1992-2000):arxiv:0911.0884 - improved constraints at low-x F2(charm) data (preliminary)- constraints on the charm mass parameter, m c (model)

E N D
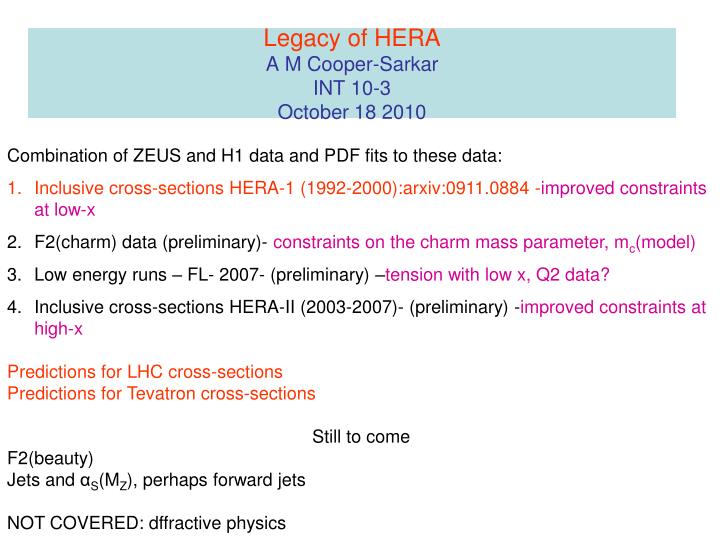
Legacy of HERAA M Cooper-SarkarINT 10-3 October 18 2010 Combination of ZEUS and H1 data and PDF fits to these data: • Inclusive cross-sections HERA-1 (1992-2000):arxiv:0911.0884 -improved constraints at low-x • F2(charm) data (preliminary)- constraints on the charm mass parameter, mc(model) • Low energy runs – FL- 2007- (preliminary) –tension with low x, Q2 data? • Inclusive cross-sections HERA-II (2003-2007)- (preliminary) -improved constraints at high-x • Predictions for LHC cross-sections • Predictions for Tevatron cross-sections • Still to come • F2(beauty) • Jets and αS(MZ), perhaps forward jets • NOT COVERED: dffractive physics
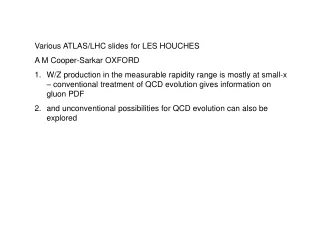
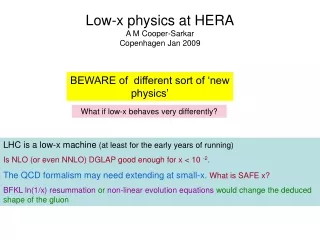
Why combine ZEUS and H1 data? At the LHC we collide protons Protons are full of partons. Our knowledge of partons comes from Deep Inelastic Scattering data. HERA dominates these data and is most relevant for the kinematic region of early LHC data We think we know how to extrapolate in Q2 using (N)NLO QCD (using the DGLAP equations) but we don’t a priori know the shapes of the parton distributions in x. The HERA data is our best guide DGLAP eqns AT this meeting I am also allowed to say that having the highest precison measurements in the low-x region is interesing in its own right!
A substantial part of the uncertainty on parton distributions comes from the need to use many different input data sets with large systematic errors and questionable levels of consistency- i ncreased χ2 tolerances are used to account for this • Averaging H1 and ZEUS data provides a model independent tool to study consistency of the data and to reduce systematic uncertainties: • Experiments cross calibrate each other JHEP 1001.109arxiv:0911.0884 • The combination method includes accounting for full systematic error correlations. • The resulting combination is much more accurate than expected from the increased statistics of combining two experiments. It’s like having had the best features of both detectors • The post-averaging systematic errors are smaller than the statistical across a large part of the kinematic plane
Data Sets 2009 average based on the complete HERA-I inclusive NC and CC DIS data: Ep=820 (s=300) and Ep=920 (s=320) GeV 200 pb-1 of e+p , 30 pb-1 of e-p • CC e- p data: H1 98, ZEUS 98 (250 ≤ Q2 ≤ 15000 GeV2) • CC e+p data: H1 94-97, H1 99-00, ZEUS 94-97, ZEUS 99-00 (250 ≤ Q2 ≤ 15000 GeV2) • NC e- p data: H1 98, ZEUS 98 (200 ≤ Q2 ≤ 30000 GeV2 • NC e+p data: ZEUS 96-97, ZEUS 99-00, H1 99-00 “high Q2”,H1 96-00 “bulk”, H1 95-00 “low-Q2”, ZEUSBPC/BPT, SVX95 “low-Q2” (0.045 < Q2 < 30,000 GeV2) The NCe+p data sets cover 5 decades of the kinematic plane in Q2 and x. The scaling violations of these data give us our best handle on the low-x gluon which is very important for Standard Model LHC physics at the W/Z scale but is also interesting in its own right The new combination supercedes all these data sets This gives 110 correlated systematic error sources 3 “procedural uncertainties” related to the averaging procedure But they are all small !
1402 data points are averaged to 741 combined data points χ2/ndf =637/656 Combining the experiments accounting for the systematic uncertainties is like having had a much better detector ZEUS γp background uncertainty is reduced by a factor of 3 H1 LAr hadron calorimeter energy scale uncertainty is halved Resulting total uncertainties are <2% over a large part of the kinematic plane AND the contribution of correlated systematics to this errors is now < statistical error
This page shows NC e+ combined data but NCe- and CCe+ and e- are also combined Results of the combination compared to the separate data sets- illustration just for a few of the NCe+ data
These data are used for extracting parton distributions: HERAPDF1.0 • Some of the debates about the best way of estimating PDF uncertainties concern the use of many different data sets with varying levels of consistency. • The combination of the HERA data yields a very accurate and consistent data set for 4 different processes: e+p and e-p Neutral and Charged Currentreactions. • Whereas the data set does not give information on every possible PDF flavour it does: • Give information on the low-x Sea(NCe+ data) • Give information on the low-x Gluon via scaling violations(NCe+ data) • Give information on high-x u (NCe+/e- and CCe-) and d ( CCe+ data) valence PDFs • Give information on u and d-valence shapes down to x~3 10-2(from the difference between NCe+ and NCe-) • We can set the experimental uncertainties on our PDFs at 68% CL by the conventional χ2 tolerance Δχ2 = 1, because we have a consistent data set • NOTE the use of a pure proton target means d-valence is extracted without need for heavy target/deuterium corrections or strong iso-spin assumptions these are the only PDFs for which this is true • Furthermore, the kinematic coverage at low-x ensures that these are the most crucial data when extrapolating predictions from W, Z and Higgs cross-sections to the LHC
Where does the information on parton distributions come from? CC e-p CC e+p d2(e-p) = GF2 M4W [x (u+c) + (1-y)2x (d+s)] d2(e+p) = GF2 M4W [x (u+c) + (1-y)2x (d+s)] dxdy 2x(Q2+M2W)2 dxdy 2x(Q2+M2W)2 • We can use the reduced cross-sections to learn about high-x valence PDFs For NC e+ and e- d2(e±N) = Y+ [ F2(x,Q2) - y2 FL(x,Q2) ± Y_xF3(x,Q2)], Y± = 1 ± (1-y)2 dxdy Y+ Y+ F2= F2γ –ve PZF2γZ + (ve2+ae2)PZ2F2Z xF3= - ae PZxF3γZ + 2veae PZ2 xF3Z Where PZ2 = Q2/(Q2 + M2Z) 1/sin2θW , and at LO [F2 ,,F2γZ, F2Z] = i [ei2,2eivi,vi2+ai2][xqi(x,Q2) + xqi(x,Q2)] [xF3γZ, xF3Z] = i [eiai,viai] [xqi(x,Q2) - xqi(x,Q2)] So that xF3γZ = 2x[euauuv + edaddv] = x/3(2uv+dv) Where xF3γZ is the dominant term in xF3 • The difference between NC e+ and e- cross-sections gives the valence structure function xF3 due to γ/Z interference and Z exchange • Note this is obtained on a pure proton target so • No heavy target corrections • No assumptions on strong isospin • (Unlike xF3 determined from neutrino scattering on heavy isocalar targets)
RESULTS for HERAPDF1.0 –arxiv:0911.0884 To appreciate how much better this is than uncombined HERA data compare the red experimental errors to this plot which shows the experimental errors for a smilar PDf fit to uncombined data And here is a summary plot of the PDF results. We estimate model and parametrisation uncertainties as well as experimental uncertainties
Consequences for W and Z production at the LHC Look at predictions for W/Z rapidity distributions: Pre- and Post-HERA Note difference in scale for fractional errors Just fixed target DIS data ~15% uncertainty Separate HERA data sets~5% uncertainty Combined HERA data set~1.5% uncertainty Why such an improvement? It’s due to the improvement in the low-x sea and gluon At the LHC the q-qbar which make the boson are mostly sea-sea partons And at Q2~MZ2the sea is driven by the gluon These illustrations at 14 TeV
Model errors are the most signficant in the central region: mc, mb, fs, Q2min mc =1.35 – 1.65 GeV is the dominant contribution… but this can be improved if F2(charm) data are used….. However PDF fitting should also include consideration of model errors and parametrisation errors HERAPDF1.0 experimental plus model errors plusparametrisation
Recently the PDF4LHC group has been considering the role that the uncertainty in the value of αS(MZ) plays in the overall uncertainty of predictions- PDFs are provided at a fixed αS(MZ) . This is not a large effect for W/Z production But the value of mc AND the scheme used to account for heavy quark production are.. Plot from G.Watt -MSTW Comparisons of W+ cross-section as a function of αS(MZ) MSTW08 CTEQ66 HERAPDF1.0 NNPDF2.0 ABKM09 GJR08 The PDF4LHC group has been considering all these PDFs at NLO NOTE many of the PDFs (NNPDF, CTEQ, MSTW,HERAPDF) are now provided for a range of αS(MZ) values
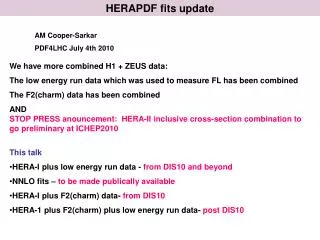
H1 and ZEUS have also combined charm data recently And the HERAPDF1.0 gives a good description of these data –within its error band- The error band spans mc=1.35 (high) to mc=1.65 (low) GeV The data show some preference for higher charm mass than the standard choice mc=1.4 GeV
If we input the charm data to the PDF fit it does not change the PDFs significantly BUT Before charm is input the χ2 profile vs the charm mass parameter is shallow.. After charm is input the χ2 profile vs the charm mass parameter gives mc = 1.57 ± 0.02 GeV
But the HERAPDF uses the Thorne General Mass Variable Flavour Number Scheme for heavy quarks as used by MSTW08 This is not the only GMVFN CTEQ use ACOT- χ NNPDF2.0 use ZMVFN These all have different preferred charm mass parameters, and all fit the data well when used with their own best fit charm mass We have re-analysed the HERAPDF+F2c data using several different heavy quark schemes Model and param. Errors included
We then use each of these schemes to predict W and Z cross-sections at the LHC (at 7 TeV) as a function of charm mass parameter If a fixed value of mc is used then the spread is considerable (~7%)- but if each prediction is taken at its own optimal mass value the spread is dramatically reduced (~2%) even when a Zero-Mass (ZMVFN) approximation has been used The PDFs MSTW08, CTEQ6.6, NNPDF2.0 do NOT use charm mass parameters at the optimal values- and this may explain their differing predictions.
H1 and ZEUS have also combined the e+p NC inclusive data from the lower proton beam energy runs (PP = 460 and 575) and produced a common FL measurement
When the low energy data are input to the HERAPDF fit it becomes evident that the low Q2/low-x data are not so well fit – Imposing a harder Q2 cut Q2 > 5 improves the situation The resulting PDFs have a somewhat different shape- less valence-like gluon at low Q2… steeper gluon at higher Q2 This is also true if you make an x cut x > 5 10-4 or a combined cut Q2 > 0.5 x-0.3
Our Regge prejudices led us to think that the sea and gluon would have soft slopes at low x ~ x -0.08 at the starting scale and THEN evolution would make them steeper. However at Q2~2 the sea has a steeper slope x -0.15 and the gluon is valence-like x +0.2 If however we distrust the formalism for low x and Q2 and we fit only data for Q2 > 5 the sea has a softer slope x -0.11 But the gluon is less valence-like x +0.08 i.e. they are both closer to the Regge soft Pomeron value of -0.08 So NLO DGLAP maybe showing signs failure at low-x, Q2 But how about NNLO DGLAP?...
HERAPDF1.0 is also available at NNLO for two values of αS(MZ) since many analyses indicate that alphas seems to be smaller at NNLO than at NLO and our own data prefer a lower value NNLO fits to HERA-I data give: First fit αS(MZ) for NLO → 0.1166 ± 0.0044(exp) χ2= 574.8 /592 Then fit αS(MZ) at NNLO→0.1145 ± 0.0042(exp)χ2= 623.5 /592 NNLO is important for precision studies of cross-section uncertainties. There are far fewer NNLO PDFS: MSTW08, ABKM NOTE: NNLO has worse χ2 than NLO and does not fit low-x Q2 data better. The χ2 is also improved if low x, Q2 cuts are imposed. In fact it is the 920 data which are worst fit at NNLO. Tension between the low and high-energy data shows up at low-x,Q2 and is not solved by moving to NNLO.
NNLO using αs(MZ)=0.1145 NLO using αs(MZ)=0.1176 NNLO Χ2/ndf 873.7/806 X/N CCEP = 1.04 34 X/N CCEM = 0.57 34 X/N NCEP= 1.24 379 X/N NCEM= 0.75 145 X/N NCEP 460/575 = 1.07 224 NLO χ2 818.5/806 X/N CCEP = 0.86 34 X/N CCEM = 0.59 34 X/N NCEP= 1.13 379 X/N NCEM= 0.74 145 X/N NCEP 460/575 = 1.04 224 NNLO Q2 > 5 Χ2/ndf 762.4/771 X/N CCEP = 0.93 34 X/N CCEM = 0.56 34 X/N NCEP= 1.10 353 X/N NCEM= 0.76 145 X/N NCEP 460/575 = 0.85 215 NLO Q2 > 5 Χ2/ndf 698.3/771 X/N CCEP = 0.85 34 X/N CCEM = 0.58 34 X/N NCEP= 1.03 353 X/N NCEM= 0.75 145 X/N NCEP 460/575 = 0.82 215
What about changes in the heavy quark scheme? Changes in the Thorne GMVFN make little difference But a change to ACOT does – this has one less power of αS in the definition of FL RT VFN χ2 818.5/806 X/N CCEP = 0.86 34 X/N CCEM = 0.58 34 X/N NCEP= 1.13 379 X/N NCEM= 0.74 145 X/N NCEP 460/575 = 1.04 224 ACOT VFN χ2 788.6/806 X/N CCEP = 0.89 34 X/N CCEM = 0.59 34 X/N NCEP= 1.09 379 X/N NCEM= 0.74 145 X/N NCEP 460/575 = 0.98 224 ACOT-χ VFN χ2 793.2/806 X/N CCEP = 0.88 34 X/N CCEM = 0.58 34 X/N NCEP= 1.13 379 X/N NCEM= 0.75 145 X/N NCEP 460/575 = 0.92 224 And so does the use of a Fixed Flavour Number sheme But all of these are improved further by x or Q2 cuts FFN χ2 724.7/738 X/N CCEP = X/N CCEM = X/N NCEP= 1.08 379 X/N NCEM= 0.76 145 X/N NCEP 460/575 = 0.92 224
NOTE there is no improvement from cutting high y. Applying x,Q2 cuts does NOT have a big effect on the description of FL. Changes of heavy quark scheme to ACOT, FFN or a change from NLO to NNLO have a bigger effect on FL Describing the integrated FL vs Q2 plot and describing the full differential cross-section data for three different proton energies are not achieved in identical ways. A precision measurement of FL(x,Q2) would have been nice.
Returning to NLO fits: How hard do we need to cut such that DGLAP fits of just Ep=920 data and fits including lower energy data are once more in good agreement? Q2 > 1.0 x-0.3 575 This implies that the ‘true’ gluon could be a little bit steeper than the HERAPDF1.0 gluon- or indeed CTEQ6.6 or MSTW08 gluons However this effect only starts to become important for x < 10-3 so W/Z cross-sections at the LHC are only marginally affected- 1-1.5% up at 7 TeV
HERA- I combination only ~250 pb-1 of data HERA-II gives 4 times as much data in total The triggers were such that most of this is at higher x and Q2 We have made a preliminary HERA-II combination- not all of the separate ZEUS and H1 inclusive data which go into this combination are yet published.
H1 and ZEUS have also combined preliminary high Q2 HERA-II data along with the HERA-I data and HERAPDF1.0 has recently been updated to HERAPDF1.5 by including these data The data on the left has been updated to the data on the right The HERAPDF1.0 fit on the left has been updated to the HERAPDF1.5 fit on the right
The data on the left has been updated to the data on the right The HERAPDF1.0 fit on the left has been updated to the HERAPDF1.5 fit on the right. The CCe- data is improved because at HERA-1 there were only 30 pb-1 of e- data, at HERA-II there are ~350pb-1
The data on the left has been updated to the data on the right The HERAPDF1.0 fit on the left has been updated to the HERAPDF1.5 fit on the right In this case ~200pb-1 of HERA-I data has been supplemented by ~300pb-1 of HERA-II data. Extra CCe+ helps to determine the d quark at high-x
The PDF uncertainties have been reduced at high-x These plots show total uncertainties (model and parametrization included) Improved determination of the d/u ratio at high-x. The only PDF which measures d in a proton rather than an isoscalar target
This reduced high-x error results in a reduced error at high rapidity for W/Z production at the LHC
How about Tevatron results? We don’t include Tevatron data in the fits but we can describe it – we CAN describe Tevatron jet data despite having a relatively soft gluon (we have harder quarks) AND we have a reasonable description of the D0 electron asymmetry data which is troublesome for some of the PDFs Note some of the trouble comes from tension with NMC and BCDMS fixed target deuteron data- deuterium corrections are one possible explanation- the HERAPDF uses only proton data and is not subject to this uncertainty
Things still to come: Inclusion of F2b- more information on gluon/heavy quark schemes Inclusion of HERA jets data- -- decrease in gluon uncertainty using fixed αS(MZ) -- decrease in gluon uncertainty using free αS(MZ) and determination of alphas and PDF simultaneously within the fit --decrease in the uncertainty of αS(MZ) Jet illustrations use ZEUS combined HERA not yet ready NOTE the HERA-jet data already give very competitive αS(MZ) determinations (not covered here)
What about Forward Jets?- combined data are still to come Comparison to conventional LO and NLO calculations- NLO below data, especially at small xBj Look at the hadron final states..lack of pt ordering has its consequences.Forward jets with xj» x and ktj2 ~ Q2 are suppressed for DGLAP evolution but not for kt disordered BFKL evolution
But there are some things that HERA did not do (apart from fail to fully exploit the low-x region!): flavour separation in the sea Strangeness has been assigned a large model error at Q20=2 sbar = (0.45± 0.15) dbar Could HERA measure strangeness? W+ +s → c Charm production in CCe+.. There is still some work going on, but statistics will be poor There is also some HERMES data which suggests that strange is not the same shape as dbar….
Then there is dbar-ubar We know this is not zero at high-x from E866 Drell-Yan measurements • The HERAPDFs are NOT in disagreement with this but could do better! • Along with most other PDFs it assumed that dbar=ubar at small-x • What if we relax this assumption… • This Toy PDF is called the HERAPDF1.u ‘unconstrained’ or ‘dissident’ PDF • It comes in two varieties: • dbar≠ubar at small x • dbar≠ubar at small x plus strangeness fixed to the HERMES shape
The dissident fit has dbar very much smaller than ubar at small-x (although slightly larger at high-x so not in disagreement with Drell-Yan data).
Strangeness evolves to become almost the same size as dbar, ubar and the difference in the Standard and the HERMES strangeness is not significant As Q2 increases the difference between dbar and ubar remains constant but the size of ubar and dbar increase rapidly at low-x so that by Q2~MW,Z 2 this difference is not very significant. However for the LHC it is still visible….
For the Tevatron x values are higher and W,Z are q-q dominated so such a ‘dissident’ PDF is not excluded For the LHC there should be obvious differences – we may even be able to exclude this with data taken this year
SUMMARY Combination of ZEUS and H1 data and PDF fits to these data: Inclusive cross-sections HERA-1 (1992-2000):arxiv:0911.0884 -improved constraints at low-x F2(charm) data (preliminary)- constraints on the charm mass parameter, mc(model) Low energy runs – FL- 2007- (preliminary) –extends the kinematic reach in the same direction as EIC-- tension with low x, Q2 data? Inclusive cross-sections HERA-II (2003-2007)- (preliminary) -improved constraints at high-x ----using only proton target Still to come: F2(beauty) HERA jet data What HERA could not do: u,d,s flavour separation in the Sea What HERA did not do: fully exploit the low-x region, precision measurement of FL
LHeC PDF improvement 100 GeV e on 7 TeV
LHeC Low-x Expansion of the kinematic regime so that low-x, x~10-4 now has Q2 up to 100 rather than 10 Can measure F2 and FL and hope to distinguish models with/without saturation etc
Averaging procedure • Swim all points to a common x-Q2 grid • Moved 820 GeV data to 920 GeV p-beam energy • Calculate average values and uncertainties • This is done by making a χ2 fit to the data points of both experiments which simply assumes that for each process (NC or CC, e+ or e-) and each x, Q2 point (i) there is only one ‘true’ value of the cross-section- these are the predictions mi – whereas there can be several measurements of this value, from ZEUS and H1 and from different years of running- these are the measurements µi • The chisq accounts for the correlated systematics of the data points- each data point can have several such uncertainties Γ, hence sum over j for each data point i, but these uncertainties are common to all data points for large sub-sets of data. The fit determines the value of the cross-sections mi and the systematic shift parameters bj • Evaluate further uncertainties due to choices in combination procedure,e.g. Correlations between ZEUS and H1
1402 data points are averaged to 741 combined data points χ2/ndf =637/656 Systematic shift parameters b, shift most systematics < 1 std deviation But the fit also determines uncertainties on the shift parameters Δb, some of these are much reduced e.g ZEUS γp background uncertainty is reduced by a factor of 3 H1 LAr hadron calorimeter energy scale uncertainty is halved Resulting total uncertainties are <2% over a large part of the kinematic plane AND the contribution of correlated systematics to this errors is now < statistical error
Correlated systematic uncertainties, χ2 and Δχ2 The data combination results in a data set which not only has improved statistical uncertainty, but also improved systematic uncertainty. Even though there are 113 sources of correlated systematic uncertainty on the data points these uncertainties are small. The total systematic uncertainty is significantly smaller than the statistical uncertainty across the the kinematic region used in the QCD fits This means that the method of treatment of correlated systematic uncertainties in our PDF fits is not crucial. We obtain similar results treating all systematic errors as correlated or as uncorrelated. For our PDF fits we combine 110 sources of systematic uncertainty from the separate experiments in quadrature and OFFSET the 3 procedural systematics which derive from the method of data combination. We set the experimental uncertainties on our PDFs at 68% CL by the conventional χ2 tolerance Δχ2 = 1
Theoretical framework Fits are made at NLO in the DGLAP formalism -using QCDNUM 17.00 The Thorne-Roberts massive variable flavour number scheme is used (2008 version) and compared with ACOT The staring scale Q20 (= 1.9 GeV2)is below the charm mass2(mc=1.4 GeV) and charm and beauty (mb=4.75) are generated dynamically A minimum Q2 cut Q2 > 3.5 GeV2 is applied to stay within the supposed region of validity of leading twist pQCD (no data are at low W2 ) Parametrisation andmodel assumptions We chose to fit the PDFs for: gluon, u-valence, d-valence and the Sea u and d-type flavours: Ubar = ubar, Dbar = dbar+sbar (below the charm threshold) To the functional form The normalisations of the gluon and valence PDFs are fixed by the momentum and number sum-rules resp. Further constraints are: B(d-valence) = B(u-valence), B(Dbar) = B(Ubar), low-x shape of Sea same for u-type+d-type A(Ubar) = A(Dbar) (1-fs), where sbar = fs Dbar, so that ubar → dbar as x→ 0 (fs=0.31)
Uncertainties due to model assumptions are evaluated by varying input values Variation of heavy quark masses: Mc=1.35 to1.65 GeV (the pole-mass) Mb= 4.3 to 5.0 GeV Variaion of the sea fraction Fs=s/(d+s) = 0.23 to 0.38 Variation of the minimum Q2 cut on data entering the fit Q2min= 2.5 to5.0 GeV2 We also vary the value of the starting scale Q20 from1.5 to 2.5 GeV2: this is considered as a parametrisation uncertainty rather than a model uncertainty…
Parametrisation uncertainties- indicative, not exhaustive The central fit is chosen as follows: start with a 9 parameter fit with all D and E parameters = 0 and then add D and E parameters one at a time noting the χ2 improvement. Chose the fit with the lowest χ2. This has E(u-valence) ≠ 0 and χ2/ndf = 574/582. This is the central fit We then start with this 10 parameter fit and add all the other D and E parameters one at a time noting the χ2 improvement. It turns out that there is no significant further improvement in χ2 for 11 parameter fits. An envelope of the shapes of these 11 parameter fits is formed and used as a parametrization error. This gives the parametrization uncertainty at high-x. • Low-x parametrisation uncertainty is accounted for by the following additional variations: • Bdv free –this results in Bdv ≈ Buv • 2. A negative gluon term: - A xB(1-x)C is added to the usual gluon term, when the starting scale of the fit is lowered to Q20=1.5 GeV2 – this results in a small –ve gluon term but the gluon itself does not become negative in the kinematic range of the data
Compared to various NLO DGLAP fits And compared to alternative theoretical predictions: White and Thorne (WT) which has NLL ln1/x resummation included Dipole Models which can accommodate non-linear effects/ saturation eg IIM colour glass condensate So do we have a smoking gun? Maybe not- but the circumstantial evidence is building up….