Download
1 / 29
300 likes | 308 Vues
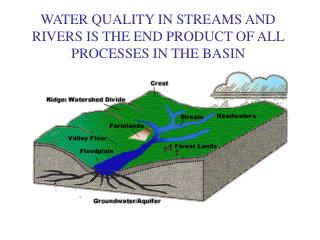
Water Quality of the Waikato and Waipa Rivers. Technical Leaders Group. Water Quality aspects in project scope. WRC Monitoring Network. 110 sites sampled monthly (most since 1989). Water quality assessments State – is it “good” or “poor”? and Trend – is it “better” or “worse”?.

E N D
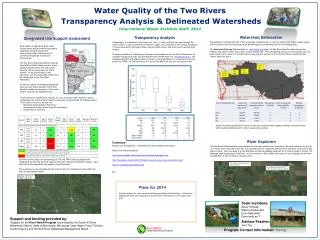
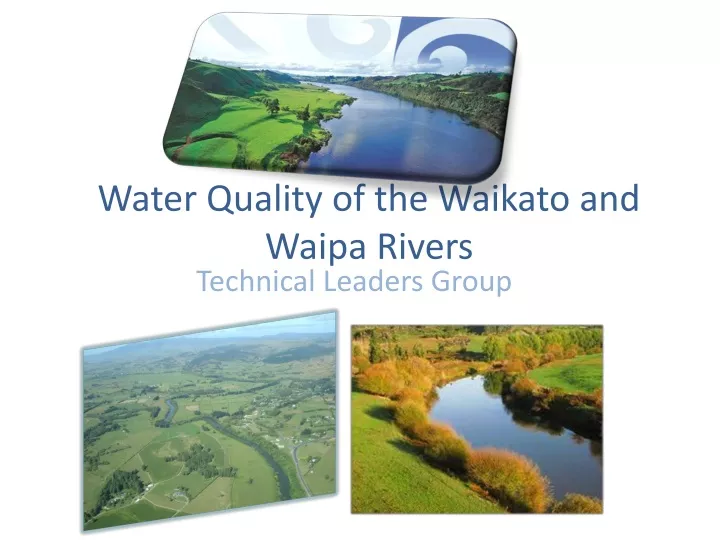
Water Quality of the Waikato and Waipa Rivers Technical Leaders Group
WRC Monitoring Network 110 sites sampled monthly (most since 1989)
Water quality assessmentsState – is it “good” or “poor”?andTrend – is it “better” or “worse”?
WRISS report card scoresKarapiro, & Tuakau 2000-09, Data source: Waikato Regional Council
Variation in Nitrogen at baseflow NIWA 2010 WRISS
Variation in Phosphorus at baseflow NIWA 2010 WRISS
Variation in pathogen indicator E. coli at baseflow along Waipa and Waikato NIWA 2010 WRISS
Waikato River maximum annual algal biomass vs National Objectives Framework (NOF) standards Data source: Waikato Regional Council
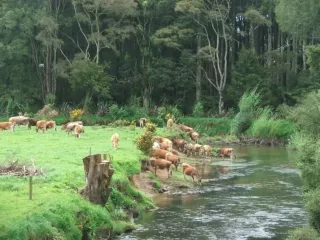
Rural sources of contaminants NIWA 2010 WRISS report
Summary: current state • excellent in places, poor in others—lowland lakes very poor • conditions are often “at least satisfactory for desired uses” • differences between zones (e.g. Waipa c.f. Lower Waikato mainstem c.f. Riverine lakes) • these broadly reflect differing intensity of land use, geography and residence time in dams
TrendsDirection of change – improvement or deteriorationRate of change – slight (<1% pa) or important (>1% pa)
A water quality record with a trend Rate = +5.8% per year
Summary: trends 1993-2012 • Some improvement (ammonia, chlorophyll); • Some deterioration (turbidity, nitrogen) • Pastoral agriculture likely to be the cause of much of the increase in nitrogen • Groundwater lags likely to influence future trends (N load to come)
The Challenge….Managing contaminant movement to waterways Location where a water quality objective/ limit has been set
Enabling tools Overseer Aquifer Modelling Aquifer Modelling Location where a water quality objective/ limit has been set CLUES
Ngā Uara me ngā Tohu Māori o te wai • Mai te timatanga o te ao, te wai – Ko Io matua kore • Na Tane te waipuhi, te waiariki, te waiora • Ko Parawhenuamea te ahuatanga o te wai • Na te Atua te kawa, na te tangata te tikanga • Ko Waikato te awa. Ka rere mai ōna wai i Te Wairere o Huka puta atu ki te Pūaha o Waikato. • He tūpuna, he tipua, he taniwha, he taonga, te kōmitititanga me te hononga o nga awa, he
Ngā Uara me ngā Tohu Māori • Nga wāhanga waiora ki Waikato • Mahinga kai • The integrity and knowledge of significant sites • Access to / abundance of taonga species • Recreation – swimming, paddling, fishing • Wai – identity, cultural practise and activities, knowledge, discrete and collective importance of bodies of water
Technical Questions from CSG#2 ANTOINE and LIZ • I think the largest challenge is to communicate the evidence/facts on sources/results of the contaminants to: • CSG (Collaborative Stakeholder Group) • Healthy Rivers decision makers • Stakeholders who have to make a change.
Technical Questions from CSG#2 MIKE • How long does it take for N in ground water to reach water bodies? • How much understanding is there about flows & direction of aquifers at different depths and direction of diffuse losses?
GRAEME • How much work has been done on milk urea nitrogen levels as a catchment tool? • JOHN • What is the amount of nutrient that a fully “natural system” either loses directly through leaf drop, soil movement or diffuse loss? (eg. Fiordland) • What is the natural (native) NP within the catchment not related to urban, industry & agriculture?
GRAEME • How can the modelling done for this process be useful over longer time to assist with continuous management and improvement? • Who will be doing the whole farm modelling? What tools will they use? • How will the economic analysis of farm level impacting thru to regional/national impacts be done? • Do we have sound information that can link possible changes/tools that might be applied with their economic impact on the communities where this would be done?