Download
1 / 8
80 likes | 143 Vues
Study the characterization of physicochemical and spectroscopic properties of biofield energy treated bio peptone in SciencePG journal of advances in bioscience & bioengineering.<br>

E N D
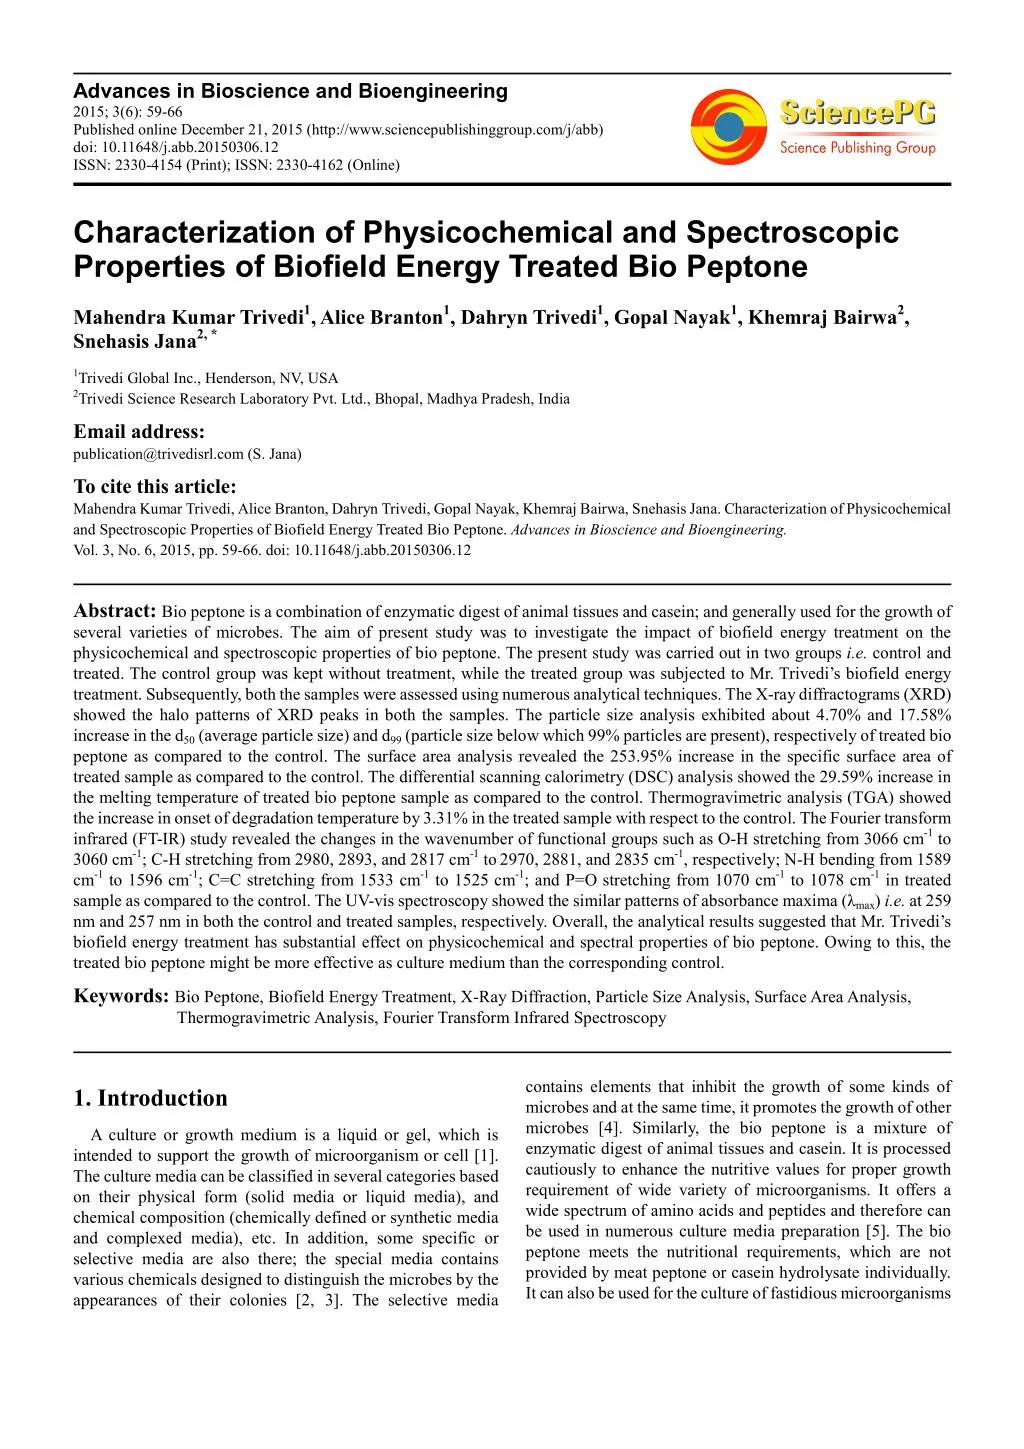
Advances in Bioscience and Bioengineering 2015; 3(6): 59-66 Published online December 21, 2015 (http://www.sciencepublishinggroup.com/j/abb) doi: 10.11648/j.abb.20150306.12 ISSN: 2330-4154 (Print); ISSN: 2330-4162 (Online) Characterization of Physicochemical and Spectroscopic Properties of Biofield Energy Treated Bio Peptone Mahendra Kumar Trivedi1, Alice Branton1, Dahryn Trivedi1, Gopal Nayak1, Khemraj Bairwa2, Snehasis Jana2, * 1Trivedi Global Inc., Henderson, NV, USA 2Trivedi Science Research Laboratory Pvt. Ltd., Bhopal, Madhya Pradesh, India Email address: publication@trivedisrl.com (S. Jana) To cite this article: Mahendra Kumar Trivedi, Alice Branton, Dahryn Trivedi, Gopal Nayak, Khemraj Bairwa, Snehasis Jana. Characterization of Physicochemical and Spectroscopic Properties of Biofield Energy Treated Bio Peptone. Advances in Bioscience and Bioengineering. Vol. 3, No. 6, 2015, pp. 59-66. doi: 10.11648/j.abb.20150306.12 Abstract: Bio peptone is a combination of enzymatic digest of animal tissues and casein; and generally used for the growth of several varieties of microbes. The aim of present study was to investigate the impact of biofield energy treatment on the physicochemical and spectroscopic properties of bio peptone. The present study was carried out in two groups i.e. control and treated. The control group was kept without treatment, while the treated group was subjected to Mr. Trivedi’s biofield energy treatment. Subsequently, both the samples were assessed using numerous analytical techniques. The X-ray diffractograms (XRD) showed the halo patterns of XRD peaks in both the samples. The particle size analysis exhibited about 4.70% and 17.58% increase in the d50 (average particle size) and d99 (particle size below which 99% particles are present), respectively of treated bio peptone as compared to the control. The surface area analysis revealed the 253.95% increase in the specific surface area of treated sample as compared to the control. The differential scanning calorimetry (DSC) analysis showed the 29.59% increase in the melting temperature of treated bio peptone sample as compared to the control. Thermogravimetric analysis (TGA) showed the increase in onset of degradation temperature by 3.31% in the treated sample with respect to the control. The Fourier transform infrared (FT-IR) study revealed the changes in the wavenumber of functional groups such as O-H stretching from 3066 cm-1 to 3060 cm-1; C-H stretching from 2980, 2893, and 2817 cm-1 to2970, 2881, and 2835 cm-1, respectively; N-H bending from 1589 cm-1 to 1596 cm-1; C=C stretching from 1533 cm-1 to 1525 cm-1; and P=O stretching from 1070 cm-1 to 1078 cm-1 in treated sample as compared to the control. The UV-vis spectroscopy showed the similar patterns of absorbance maxima (λmax) i.e. at 259 nm and 257 nm in both the control and treated samples, respectively. Overall, the analytical results suggested that Mr. Trivedi’s biofield energy treatment has substantial effect on physicochemical and spectral properties of bio peptone. Owing to this, the treated bio peptone might be more effective as culture medium than the corresponding control. Keywords: Bio Peptone, Biofield Energy Treatment, X-Ray Diffraction, Particle Size Analysis, Surface Area Analysis, Thermogravimetric Analysis, Fourier Transform Infrared Spectroscopy contains elements that inhibit the growth of some kinds of microbes and at the same time, it promotes the growth of other microbes [4]. Similarly, the bio peptone is a mixture of enzymatic digest of animal tissues and casein. It is processed cautiously to enhance the nutritive values for proper growth requirement of wide variety of microorganisms. It offers a wide spectrum of amino acids and peptides and therefore can be used in numerous culture media preparation [5]. The bio peptone meets the nutritional requirements, which are not provided by meat peptone or casein hydrolysate individually. It can also be used for the culture of fastidious microorganisms 1. Introduction A culture or growth medium is a liquid or gel, which is intended to support the growth of microorganism or cell [1]. The culture media can be classified in several categories based on their physical form (solid media or liquid media), and chemical composition (chemically defined or synthetic media and complexed media), etc. In addition, some specific or selective media are also there; the special media contains various chemicals designed to distinguish the microbes by the appearances of their colonies [2, 3]. The selective media
Advances in Bioscience and Bioengineering 2015; 3(6): 59-66 60 and production of enzymes, antibiotics, and other microbiological origin products [6]. Sterilization process plays a significant role on the quality of culture media. The autoclaving is the standard method of culture media sterilization [7]. However, the heat treatment of complex culture media may result in destruction of the nutrients either by direct thermal degradation or by the chemical reactions among the components [8]. Hence, a technique is required, which can enhance the overall stability of the bio peptone [9]. In the recent past years, the energy therapies have been reported for beneficial effects in several field throughout the word [10]. Biofield energy treatment is one of the energy therapies [11]. The energy medicines have been categorized under the Complementary and Alternative Medicine (CAM) therapies by National Institute of Health (NIH)/National Center for Complementary and Alternative Medicine (NCCAM) [12]. Consciousness is one of the possible mechanisms among the several proposed one to support the biofield energy therapies. It includes healer’s intent to heal, and may interact with the physical realm [13]. Similarly, physical resonance is another theory, which comprises subtle energies. As per the physical resonance theory, the energy can be exchanged between the energy fields of healer and patient [14]. Mr. Mahendra Kumar Trivedi is a renowned practitioner of energy medicine. He can harnesses the energy from universe and transfers it to the object (living or non-living); this procedure is termed as biofield energy treatment (The Trivedi Effect®). The Trivedi Effect® has been studied in the several fields such as agricultural science research [15], microbiology research [16], and biotechnology research [17], etc. In addition, Mr. Trivedi’s biofield energy treatment has been also reported to alter the various physicochemical properties of organic products [18] and organic compounds [19]. Based on the above mentioned literature reports on biofield energy treatment and the uses of bio peptone in the culture media, the present study was designed to investigate the effect of biofield energy treatment on bio peptone. The treated bio peptone was analyzed using several analytical techniques to assess any modification in its physicochemical and spectroscopic properties. The data of treated sample were compared with that of control sample. unique thought transmission process without touching the sample under standard laboratory conditions. After treatment, the treated samples were stored at standard laboratory conditions, and subsequently, both the treated and control samples were evaluated using several analytical techniques such as X-ray diffractometry (XRD), particle size analysis, surface area analysis, differential scanning calorimetry (DSC), thermogravimetric analysis/derivative (TGA/DTG), Fourier transform infrared (FT-IR), and UV-vis spectroscopy. thermogravimetry 2.3. XRD Study The XRD study of control and treated bio peptone samples was carried out on Phillips (Holland PW 1710) X-ray diffractometer. The XRD instrument was equipped with nickel filter and copper anode. The XRD analysis was done at the wavelength of 1.54056 Å. 2.4. Particle Size Analysis The particle size of control and treated bio peptone sample was measured using the laser particle size analyzer (Sympatec HELOS-BF). The detection range of instrument was set in the range of 0.1–875 µm. The raw data were obtained in the chart form with particle size on x-axis and cumulative percentage on y-axis. The percent alteration in particle size was inferred using the following equation. % change in particle size,d??= ?????? ?????? !????? "#$??#%& ????? "#$??#% × 100 (1) Where, (d50) Control and (d50) Treated are the average particle size of control and treated samples, respectively; correspondingly the d99 was calculated. 2.5. Surface Area Analysis The surface area of control and treated bio peptone was determined using the ASTM D 5604 method on Brunauer– Emmett–Teller (BET) surface area analyzer (Smart SORB 90). The instrument range was set from 0.2 m2/g to 1000 m2/g. The percent change in the surface area of treated sample with respect to the control was calculated using the following equation. 2. Experimental ?, ?????? !, "#$??#%& , "#$??#% % change in surface area = × 100 (2) 2.1. Materials Here, S Control and S Treated is the surface area of control and treated samples, respectively. Bio peptone was procured from HiMedia Laboratories, India. 2.6. DSC Study 2.2. Biofield Energy Treatment Modalities The melting temperature of control and treated bio peptone was determined using the Pyris-6 Perkin Elmer differential scanning calorimeter. In this experiment, the analytes were heated at the rate of 10°C /min under the air atmosphere with the flow rate of 5 mL/min. An empty pan sealed with cover lid was used as the reference pan. The melting temperature (Tm) The bio peptone sample was divided into two parts: control and treated. The control sample was kept without treatment, while the treated sample was handed over in sealed pack to Mr. Trivedi for the biofield energy treatment. Mr. Trivedi provided the biofield energy treatment to the treated group via his
61 Mahendra Kumar Trivedi et al.: Characterization of Physicochemical and Spectroscopic Properties of Biofield Energy Treated Bio Peptone of both the control and treated samples were obtained from the DSC thermograms. The d99 values were observed as 107.74 µm and 126.68 µm, in control and treated samples, respectively. The results showed about 4.70% increase in the d50 and 17.58% increase in the d99 values of treated bio peptone with respect to the control bio peptone. 2.7. TGA/DTG Analysis The TGA/DTG analysis of both control and treated bio peptone samples were performed on Mettler Toledo simultaneous TGA/DTG analyzer. The analytes were heated up to 400°C (at the rate of 5°C /min) from room temperature under the air atmosphere. The onset temperature of thermal degradation and temperature at which maximum weight loss occurred (Tmax) in samples were found from the TGA/DTG thermograms. 2.8. FT-IR Spectroscopic Analysis The FT-IR spectroscopic analysis of both the control and treated bio peptone samples were carried out to evaluate the effect of biofield energy treatment on molecular levels like force constant and bond strength in chemical structure [20]. The samples for FT-IR spectroscopy were prepared by crushing the powdered bio peptone sample with KBr into fine powder and then pressing into pellets. The FT-IR spectra were obtained from the Shimadzu’s Fourier transform infrared spectrometer (Japan) in the frequency region of 500-4000 cm-1. 2.9. UV-Vis Spectroscopic Analysis The spectra of control and treated bio peptone samples were recorded on Shimadzu UV spectrometer (2400 PC). The UV spectrometer was equipped with quartz cell of 1 cm with a slit width of 2.0 nm, and the wavelength was set to 200-400 nm. Figure 1. XRD diffractograms of control and treated bio peptone. 3. Results and Discussion 3.1. XRD Analysis The XRD diffractograms of control and treated bio peptone samples are shown in Fig. 1. It showed the broad halo at 2θ equals to 21° in both the samples. These halo patterns of XRD peaks suggested the amorphous nature of both control and treated samples [21]. The XRD study suggested that biofield energy treatment did not induce any changes in the crystal structure of bio peptone with respect to the control sample. Amorphous material is the noncrystalline solid in which the atoms and molecules are unorganized in a definite lattice pattern [22]. They did not possess the long-range order of atomic positions in crystals, but retain the short-range order typical of liquids. The amorphous form of solid is more soluble in water and other solvent and relatively stable than the crystalline solids [23]. Figure 2. Particle size of control and treated bio peptone. It is supposed that the biofield energy possibly induce the agglomeration process in treated bio peptone molecules that leads to increases of particle sizes (d50 and d99) of treated sample. Recently, a biofield-induced alteration in the particle sizes of bile salt and proteose peptone have been reported by our group [24]. 3.2. Particle Size Analysis The average particle size (d50) and the particle size below which 99% particles are present (d99) in control and treated samples were determined by laser particle size analyzer, and results are shown in Fig. 2. It showed the d50 values as 12.56 µm and 13.15 µm in control and treated samples, respectively. 3.3. Surface Area Analysis The surface areas of control and treated bio peptone samples
Advances in Bioscience and Bioengineering 2015; 3(6): 59-66 62 were determined with the help of BET surface area analyzer. The surface area of control and treated samples was observed as 0.2758 m2/g and 0.9762 m2/g, respectively. The result exhibited significant increase in surface area by 253.95% in the treated sample as compared to the control bio peptone (Fig. 3). It is reported that surface area is inversely proportional to the particle size [25]. However, in this study both the particle size and surface area were increased, which was contrary. This is possible when the porosity induces or increases in the particles, which leads to increase in the effective surface area [26]. Furthermore, due to increases in surface free energy, the particles aggregate to form the larger particles, which also cause to increase in the particle size with increase in the surface area [27]. Based on this, it is presumed that biofield energy probably induced the aggregation of bio peptone particle with enhanced porosity, which may lead to increase the particle size as well as the surface area of treated sample with respect to the control. Figure 4. DSC thermograms of control and treated bio peptone. Table 1. Thermal analysis of control and treated samples of bio peptone. Parameter Control Treated Figure 3. Surface area of control and treated bio peptone. Melting point (°C) 155.29 201.24 3.4. DSC Analysis Onset temperature (°C) 181.00 187.00 Tmax (°C) 269.12 217.77 DSC analysis was carried out to determine the melting temperature of bio peptone (control and treated). DSC thermograms of control and treated bio peptone are presented in Fig. 4. The melting temperatures of control and treated bio peptone were observed as 155.29°C and 201.24°C, respectively. The results showed a significant increase (29.59%) in the melting temperature of treated sample with respect to the control (Table 1). This increase in the melting temperature might be correlated to the enhanced thermal stability [28, 29]. The melting point of treated sample might increase due to increase in the particle size [30]. Furthermore, the stronger intermolecular attractions lead to higher melting points [31]. Based on this, it is hypothesized that the biofield energy treatment increased the intermolecular interaction in bio peptone molecules, which resulted into enhanced melting temperature with respect to the untreated sample. The thermal study suggested that the treated bio peptone might be more thermally stable than the control sample. Tmax: temperature at which maximum weight loss occurs 3.5. TGA/DTG Analysis The TGA/DTG thermograms of control and treated bio peptone samples are shown in Fig. 5, and data are reported in Table 1. The TGA thermogram of control sample showed a broad single step of thermal degradation pattern. The sample started to degrade from 181°C (onset temperature) and terminated at 355°C (endset temperature). On the other hand, the treated sample showed the two steps of thermal degradation; the first step was initiated from 187°C and ended at 245°C. The second step was started from 261°C and terminated at about 369°C. The result showed the slight increase (3.31%) in the onset temperature of thermal degradation in the treated sample with respect to the control. This might be correlated to the increased thermal stability of the treated sample as compared to the control [32]. Based on this it is depicted that the biofield treated bio peptone is more thermally stable than the control sample.
63 Mahendra Kumar Trivedi et al.: Characterization of Physicochemical and Spectroscopic Properties of Biofield Energy Treated Bio Peptone Figure 5. TGA/DTG thermogram of control and treated bio peptone. 3.6. FT-IR Spectroscopic Characterization force constant and bond strength of O-H or N-H group might decrease in the treated sample as compared to the control. Further, the vibration peaks at 2980, 2893, and 2817 cm-1 in the control sample might be attributed to the C-H stretching. These peaks were correspondingly observed at the frequency region of 2970, 2881, and 2835 cm-1 in the treated sample. This showed the significant change in the wavenumber of C-H stretching in the treated sample with respect to the control. The IR frequency at 1635 cm-1 might be due to C=O stretching of amino acids in both the control and treated samples. The IR peak at 1589 cm-1 in control might be due to N-H bending that was shifted to higher frequency region i.e. at 1596 cm-1 in the treated sample. This showed the increase in the rigidity of N-H group in the treated sample with respect to the control. The FT-IR spectra of both the control and treated bio peptone are shown in Fig. 6. The bio peptone is the mixture of enzymatic digest of animal tissues and casein, which contains several proteins, phosphoproteins, minerals, amino acids, etc. [6]. Due to the presence of these diverse components, the FT-IR spectra may contain several vibrational peaks such as amide (N-H, C=O), aromatic ring (C-H, C=C) etc. The FT-IR spectrum of control sample showed the broad vibrational peak at 3066 cm-1 that may be due to O-H or N-H stretching of amino acids. This peak was appeared at the slight downstream frequency region i.e. at 3060 cm-1 in the treated sample. It is well known that the stretching frequency of any functional group or bond is directly proportional to the force constant [33]. Therefore, it is anticipated that biofield energy treatment might decrease the dipole moment of O-H or N-H bond in the treated sample of bio peptone as compared to the control. Hence, the
Advances in Bioscience and Bioengineering 2015; 3(6): 59-66 64 Figure 6. FT-IR spectra of control and treated bio peptone. Similarly, the vibrational peak at 1533 cm-1 in the control sample might be assigned to the C=C stretching, which was sifted to 1525 cm-1 in the treated sample. This might be due to decrease in the bond strength of C=C bond in the treated sample as compared to the control. Further, the vibrational peaks at 1400, 1338, and 1245 cm-1 were might be assigned to the O-H or C-H bending, N=O or C-N stretching, and C-C stretching, respectively in the control sample. These peaks were correspondingly appeared at 1402, 1338, and 1244 cm-1 in the treated sample of bio peptone. The peak at 1151 cm-1 in control sample might be assigned to C-O stretching that was not detected in the treated sample. The IR peak at 1070 cm-1 might be assigned to P=O stretching of phosphoproteins, which was shifted to upstream region i.e. at 1078 cm-1 in the treated sample. This showed the increased bond strength of P=O bond in the treated sample with respect to the control sample. Finally, the IR peaks at 921 and 536 cm-1 were might be assigned to P-H bending and out of plane ring deformation, respectively in both the control and treated samples. Altogether, the FT-IR study suggested the impact of biofield energy treatment on bond strength and force constant of functional groups such as C-H, C=C, N-H, C-O, and P=O with respect to the control bio peptone. 3.7. UV-Vis Spectroscopic Characterization The UV spectra of the control and treated bio peptone are
65 Mahendra Kumar Trivedi et al.: Characterization of Physicochemical and Spectroscopic Properties of Biofield Energy Treated Bio Peptone shown in Fig. 7. The UV spectrum of control sample showed the absorbance maxima (λmax) at 259 nm. Similarly, the UV spectra of treated sample showed the λmax at 257 nm in treated sample. The result showed the similar pattern of λmax in both the control and treated samples. The compound absorbs UV waves due to excitation of electrons from highest energy occupied molecular orbital (HOMO) to the lowest energy unoccupied molecular orbital (LUMO). The λmax altered correspondingly when the HOMO-LUMO gap altered [20]. This suggests that biofield energy treatment did not show any alteration in the λmax, which suggested that HOMO-LUMO gap in the treated sample was not altered with respect to the control. Figure 7. UV spectra of control and treated bio peptone. 4. Conclusions Abbreviations The XRD study revealed the amorphous nature of bio peptone in both the control and treated samples. The particle size analysis showed the increase in the particle sizes i.e. d50 and d99 of the treated bio peptone as compared to the control. The surface area analysis showed the increase in the effective surface area of treated sample by 253.95% as compared to the control. The DSC study showed the significant increase in the melting temperature of treated sample by 29.59% as compared to the control. Furthermore, the TGA/DTG study revealed the slight increase in onset temperature of thermal degradation from 181°C (control) to 187°C in treated sample. This revealed that thermal stability of the treated sample was increased as compared to the control. The FT-IR study revealed the alteration in wavenumber corresponding to N-H, C-H, C=C, C-O, and P=O vibrations after biofield energy treatment as compared to the control sample. Based on these results, it is concluded that Mr. Trivedi’s biofield energy treatment had the considerable impact on the various physicochemical and spectroscopic properties of bio peptone. Further, it is expected that the biofield energy treated bio peptone could serve as a better component of culture media with respect to the thermal stability. NIH: National Institute of Health; NCCAM: National Center for Complementary and Alternative Medicine; XRD: X-ray diffraction; DTG: Derivative Thermogravimetry; TGA: Thermogravimetric Analysis Acknowledgments The authors thank the whole scientific team of MGV pharmacy college, Nashik for allowing the instrumental facility. Authors would also like to acknowledge the Trivedi Testimonials, Trivedi Science, and Trivedi Master Wellness for their consistent support during the study. References [1] Madigan M, Martinko J (2005) Brock biology of microorganisms. (11thedn), Prentice Hall. Upper saddle river, NJ, USA. [2]Wade J, Graver M (2010) Chemically defined culture medium for neisseria. US 20100003740 A1.
Advances in Bioscience and Bioengineering 2015; 3(6): 59-66 66 [3]Schlegel HG, Zaborosch C, Kogut M (1993). General Microbiology. (7thedn), Cambridge university press, New York, USA. quality of beef extract and meat infusion powder. J Nutr Food Sci 5: 389. [19]Trivedi MK, Patil S, Shettigar H, Singh R, Jana S (2015) An impact of biofield treatment on spectroscopic characterization of pharmaceutical compounds. Mod Chem appl 3: 159. [4] Todar K (2000) Culture Media for the Growth of Bacteria. University of http://lecturer.ukdw.ac.id/dhira/NutritionGrowth/culturemedia.ht ml Wisconins-Madison. [20]Pavia DL, Lampman GM, Kriz GS (2001) Introduction to spectroscopy. (3rdedn), Thomson Learning, Singapore. [5]Atlas RM (2010) Handbook of Microbiological Media. (4thedn), CRC press, Taylor and Francis group, New York, USA. [21]Chauhan A, Chauhan P (2014) Powder XRD technique and its applications in science and technology. J Anal Bioanal Tech 5: 212. [6]http://himedialabs.com/TD/RM021.pdf [22]http://www.britannica.com/science/amorphous-solid [7]Rivera-Posada J, Caballes CF, Pratchett MS (2013) Lethal doses of oxbile, peptones and thiosulfate-citrate-bile-sucrose agar (TCBS) for Acanthaster planci; Exploring alternative population control options. Mar Pollut Bull 75: 133-139. [23]Gad SC (2008) Pharmaceutical manufacturing handbook: Production and processes. John Wiley & Sons, Inc., Publication, New Jersey, USA. [24]Trivedi MK, Patil S, Mishra RK, Jana S (2015) thermal and physical properties of biofield treated bile salt and proteose peptone. J Anal Bioanal Tech 6: 256. [8]Basu S, Pal A, Desai PK (2005) Quality control of culture media in a microbiology laboratory. Ind J Med Microbiol 23: 159-163. [25]Groza JR, Shackelford JF (2007) Materials processing handbook. Taylor and Francis group, CRC Press. [9]Ellaiah P, Srinivasulu B, Adinarayana K (2002) A review on microbial alkaline proteases. J Sci Ind Res 61: 690-704. [26]Suttiponparnit K, Jiang J, Sahu M, Suvachittanont S, Charinpanitkul T, et al (2011) Role of surface area, primary particle size, and crystal phase on titanium dioxide nanoparticle dispersion properties. Nanoscale Res Lett 6: 27. [10]Rubik B (2002) The biofield hypothesis: Its biophysical basis and role in medicine. J Altern Complement Med 8: 703-717. [11]Rindfleisch JA (2010) Biofield therapies: Energy medicine and primary care. Prim Care 37: 165-179. [27]Paradkar AR, Bakliwal S (2008). Biopharmaceutics and pharmacokinetics. (3rdedn), Pragati Books Pvt. Ltd., Pune, India. [12]NIH, National center for complementary and alternative medicine. CAM basics. Publication 347. [October 2, 2008]. Available at: http://nccam.nih.gov/health/whatiscam/ [28]Kumar S, Tsai CJ, Nussinov R (2000) Factors enhancing protein thermostability. Protein Eng 13: 179-191. [13]Jahn RG, Dunne BJ (1988) Margins of reality: The role of consciousness in the physical world. San Diego, CA: Harcourt Brace Jovanovich. [29]Ratta V (1999) Crystallization, morphology, thermal stability and adhesive properties of novel high performance semicrystalline http://scholar.lib.vt.edu/theses/available/etd-051799-162256/u nrestricted/polyimide6.pdf [14]Rosch PJ (2009) Bioelectromagnetic and subtle energy medicine. The Interface between mind and matter. Longevity, regeneration and optimal health, New York Academy of Science. polyimides. VT. [30]Qi WH, Wang MP (2004) Size and shape dependent melting temperature of metallic nanoparticles. Mater Chem Phys 88: 280-284. [15]Sances F, Flora E, Patil S, Spence A, Shinde V (2013) Impact of Biofield treatment on ginseng and organic blueberry yield. Agrivita, J Agric Sci 35: 22-29. [31]DeVito SC, Farris CA (1997) Premanufacture notification: Chemistry assistance for submitters. John Wiley & Sons, INC., New York, USA. [16]Trivedi MK, Patil S, Shettigar H, Mondal SC, Jana S (2015) An impact of biofield treatment: Antimycobacterial susceptibility potential using BACTEC 460/MGIT-TB system. Mycobact Dis 5: 189. [32]Spear RJ, Maksacheff M (1986) The relationship between ignition temperature and thermal stability for selected primary explosives. Thermochim Acta 105: 287-293. [17]Patil SA, Nayak GB, Barve SS, Tembe RP, Khan RR (2012) Impact of biofield treatment on growth and anatomical characteristics of Pogostemon cablin (Benth.). Biotechnology 11: 154-162. [33]Smith BC (1998) Infrared spectral interpretation: A systematic approach. CRC Press. [18]Trivedi MK, Nayak G, Patil S, Tallapragada RM, Jana S, et al. (2015) Bio-field treatment: An effective strategy to improve the