Download
1 / 28
280 likes | 417 Vues
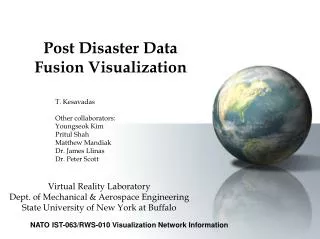
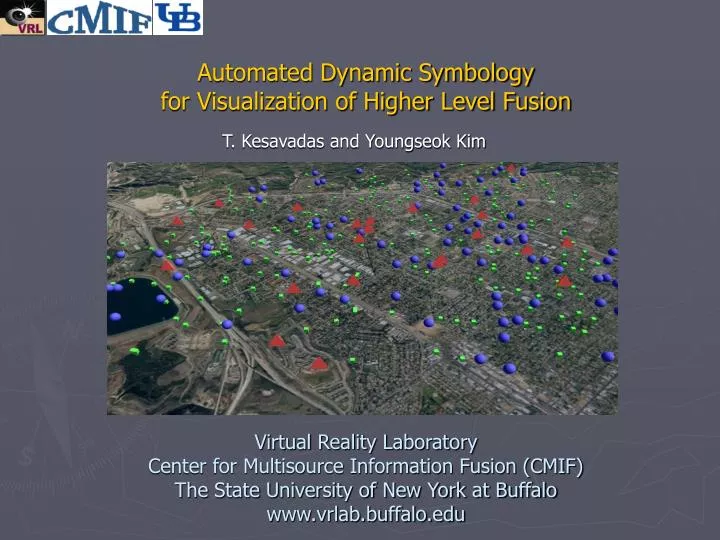
Automated Dynamic Symbology for Visualization of Higher Level Fusion. T. Kesavadas and Youngseok Kim. Virtual Reality Laboratory Center for Multisource Information Fusion (CMIF) The State University of New York at Buffalo www.vrlab.buffalo.edu. Preview.

E N D
Automated Dynamic Symbologyfor Visualization of Higher Level Fusion T. Kesavadas and Youngseok Kim Virtual Reality Laboratory Center for Multisource Information Fusion (CMIF) The State University of New York at Buffalo www.vrlab.buffalo.edu
Preview • Features of Fusion Visualization (related to COP) • Visualization Tasks for Fusion • Low Level Fusion • High Level Fusion • Future Work
Our Simulation Environment & Goal • Simulation Environment: Natural/man-made post-disaster situation. • Simulator: The Run-Time Interface (RTI) for earthquake in Northridge, CA. in 1994. (There are several federates in RTI, such as report generator, data fusion, walk-in casualty, medical facility, dispatcher-router, and visualization.) • The goal of the visualization federate is:to develop effective display and user interface for monitoring, situation awareness (SA), and decision support for command and control.
GIS Vector Map Raster Map Matching UTM Coordinate Positioning Symbols Dynamic Symbology Tactical & Seamless Graphics Viz. of Casualty Groups Visualization Tasks for Low & High Level Fusion Fusion Levels & Goals Visualization Tasks Position, Identification Level 1 Positioning identifying symbols on the map. Situation Awareness Level 2 Showing the pattern and its meaning. Threat Assessment Level 3
Post-disaster Visualization • Earthquake simulation for Northridge area, CA • There are too many cluttered and overlapped icons, and hard to recognize the situation. • Viz. of high level fusion started with “Symbology” study.
Visualization for High Level Fusion • Situation Awareness (Level 2) • Goal: Display patterns and tactical information. • Related Tasks: • Automated Dynamic Symbology • Tactical Symbols • Tactical Graphics • 2. Seamless Transition in Display • Transparency Control • Application to Casualty Grouping
Early Symbology • Related Research (’60s ~ early ’90s) • Mostly implemented by US Army Research Institute for the behavioral and social science • Difficult to apply to today’s display of variable symbol features (size, color, visual effects, etc.) Various types of symbol: (a)tactical symbol, (b) image mapped on 3D cubes, (c) detailed icon, (d) blocked outline for larger pixel CRT, (e) filled silhouette, (f) outlined silhouette, and (g) and detailed 3D model
Early Symbology • References on Symbols Department of the Army Field Manual. Military symbols. U.S. Army Field Manual (FM 21-30). Headquarters, Department of the Army, 1965. Michael G. Samet, Ralph E. Geiselman and Betty M. Landee. An experimental evaluation of tactical symbol-design features.Technical Report 498. U.S. Army Research Institute for the Behavioral and Social Science. April, 1980. Beverly G. Knapp. The Precedence of Global Features in the Perception of Map Symbols.U.S. Army Technical Report 803. ARI Field Unit at Fort Huachuca, Arizona, USA, 1988. Elizabeth Wheatley. An experiment on coding preference for display symbols. Ergonomics, 20(5), pages 543-552. 1977. Philip Bersh, Franklin L. Moses and Richard E. Maisano. Investigation of the strength of association between graphic symbology and military information.Technical Report 324. U.S. Army Research Institute for the Behavioral and Social Science. September, 1978.
Modern Symbology • Recent Research • Establish parametric method for remote applications (based on XML type architecture). • MIL-STD-2525B (1999). Common War-fighting Symbology Department of Defense Interface Standard. U.S. Department of Defense. • Two types of symbols are suitable for strategic level • Tactical Symbols • Tactical Graphics (a) Tactical Symbols (b) Tactical Graphics
Our Dynamic Symbology • Definition • Dynamic Symbology is a parameterized symbol system in which the values of symbolic entities and graphical properties are generated/calculated in runtime.\ • Goal: System Automation, Flexibility and Remoteness • No need to maintain large number of fixed symbol sets
Dynamic Symbology • Automation • Tactical symbols and graphics are generated by composing its components. • Flexibility • Symbols/graphics images are not pre-defined, but generated at run-time. Display can be changed dynamically to fit a user’s need during the simulation. Tactical Symbol Components Tactical Graphics Components
Dynamic Symbology • Controlling Visual Effects • Can be used for various visual effects and human factors • Example: Uncertainty visualization with blurred symbol Uncertainty 50 % • 100 Levels of degraded images are generated from only one icon image • Dynamically generated at run time • saves time of manual image processing Uncertainty 0 %
Tactical Graphics • Tactical Graphics for Fusion Visualization • “Tactical Graphics often produce better results in situation understanding, especially for experienced users.” (Feibush, Gagvani & Williams, Visualization for situation awareness. IEEE Graphics. pp. 38-45. September/October 2000) • Tactical Graphics is useful for visualization of higher level fusion, since it provides strategic view. • Automation of tactical graphics can improve situation awareness. • Can be applied to visualization of a large number of casualties.
Tactical Graphics • Problem in Visualization • Current visualization is for location & identification of each casualty from RTI reports. • However, with a large number of similar icons, information is usually overloaded with cluttered and overlapped icons.
Tactical Graphics • Current visualization is for location & identification of each casualty from RTI reports. • However, with a large number of similar icons, information is usually overloaded with cluttered and overlapped icons. • Grouping can be an efficient Tactical Graphics • Proposed Solution Identification (Lower Fusion Level) Seamless Transition Situation Awareness (Higher Fusion Level)
Seamless Transition • Why Seamless Transition? • Too Much Detail or High Realism Can Distract User • Retains Focus on Objects of Interest • Saves Time for researching in Different Display • Alleviates Work Stress Level 0 & 1 Level 2 Position,Identification Situation Awareness Common Display
Seamless Transition • Transparency (Opacity) Control • Transparency blends two or more state • The level of blending can be obtained by interpolation curves, such as Bernstein’s blending curves or any sinusoidal curves which make all sums to 1.0. Opacity 1.0 Color None Black & White 0 Realism Abstractness
Seamless Transition • Transition from Raster Map to Analysis Space • Visual attributes are manipulated for seamless transition Realism Abstractness Color, B&W, Transparency Position Pattern (Level 0 & 1) (Level 2 & 3)
Visualization of Casualties • Features • C++ & OpenGL program in 3D environment • Raster map was made with aerial photos of Northridge Region • Used casualty data from RTI report • Groups are sorted by three severity levels (1,2 &3) • Outlined groups are shown over the raster map • GUI for Seamless Transition
Visualization of Casualty Groups Severity of Casualties Level 1 Level 2 Level 3 Raster map + Casualty groups
Visualization of Casualty Groups More opacity added
Visualization of Casualty Groups Removed the realism of raster map
Visualization of Casualty Groups The overlapped regions in purple can be regarded as dense areas. Level 3 groups (in red) added
Visualization of Casualty Groups Added the context of raster map
Future Works • Continue Situation Awareness Development • Casualty Groups • Real Data from Fusion Federate • Interface Design for Fast Identification • Visualization of Statistical Data • 3D Urban City Modeling and VR Simulation of Earthquake Impact • Fusion representation • Damage and Fire Simulation • Time-aggregation data (statistical information) • Performance Evaluation of the Viz. & UI system
Acknowledgement This work was supported by the AFOSR under award F49620-01-1-0371. The authors gratefully acknowledge valuable input from Dr. Peter D. Scott, Dr. James Llinas and Dr. Ann M. Bisantz. Contact Dr. T. Kesavadaskesh@eng.buffalo.eduOr visit us online: Virtual Reality Laboratory www.vrlab.buffalo.edu