Download
1 / 14
150 likes | 345 Vues
A system of linear inequalities is a set of two or more linear inequalities with the same variables. The solution to a system of inequalities is the region where the shadings overlap is the solution region. Example 3: Geometry Application.

E N D
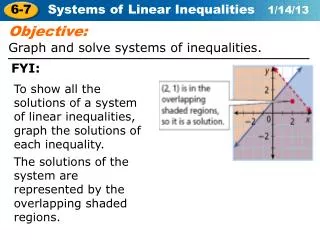
A system of linear inequalities is a set of two or more linear inequalities with the same variables. The solution to a system of inequalities is the region where the shadings overlap is the solution region.
Example 3: Geometry Application Graph the system of inequalities, and classify the figure created by the solution region. x ≥ –2 x ≤ 3 y ≥ –x + 1 y ≤ 4
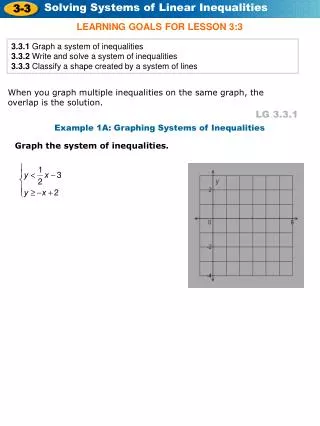
y< – 3 y ≥–x + 2 For y < – 3, graph the dashed boundary line y =– 3, and shade below it. Example 1A: Graphing Systems of Inequalities Graph the system of inequalities. For y ≥ –x + 2, graph the solid boundary line y = –x + 2, and shade above it. The overlapping region is the solution region.
For x – 3y < 6, graph the dashed boundary line y = – 2, and shade above it. Check It Out! Example 1a Graph the system of inequalities. x – 3y< 6 2x + y > 1.5 For 2x + y > 1.5, graph the dashed boundary line y = –2x + 1.5, and shade above it. The overlapping region is the solution region.
Example 2: Art Application Lauren wants to paint no more than 70 plates for the art show. It costs her at least $50 plus $2 per item to produce red plates and $3 per item to produce gold plates. She wants to spend no more than $215. Write and graph a system of inequalities that can be used to determine the number of each plate that Lauren can make.
Example 2 Continued Let x represent the number of red plates, and let y represent the number of gold plates. The total number of plates Lauren is willing to paint can be modeled by the inequality x + y ≤ 70. The amount of money that Lauren is willing to spend can be modeled by 50 + 2x + 3y ≤ 215. x 0 y 0 The system of inequalities is . x + y ≤ 70 50 + 2x + 3y ≤ 215
Example 2 Continued Graph the solid boundary line x + y = 70, and shade below it. Graph the solid boundary line 50 + 2x + 3y ≤ 215, and shade below it. The overlapping region is the solution region.
Example 2 Continued Check Test the point (20, 20) in both inequalities. This point represents painting 20 red and 20 gold plates. x + y ≤ 70 50 + 2x + 3y ≤ 215 20 + 20 ≤ 70 50 + 2(20) + 3(20) ≤ 215 40 ≤ 70 150 ≤ 215
Check It Out! Example 2 Leyla is selling hot dogs and spicy sausages at the fair. She has only 40 buns, so she can sell no more than a total of 40 hot dogs and spicy sausages. Each hot dog sells for $2, and each sausage sells for $2.50. Leyla needs at least $90 in sales to meet her goal. Write and graph a system of inequalities that models this situation.
Check It Out! Example 2 Continued Let d represent the number of hot dogs, and let s represent the number of sausages. The total number of buns Leyla has can be modeled by the inequality d + s ≤ 40. The amount of money that Leyla needs to meet her goal can be modeled by 2d + 2.5s ≥ 90. d 0 s 0 The system of inequalities is . d + s ≤ 40 2d + 2.5s ≥ 90
Check It Out! Example 2 Continued Graph the solid boundary line d + s = 40, and shade below it. Graph the solid boundary line 2d + 2.5s ≥ 90, and shade above it. The overlapping region is the solution region.
Check It Out! Example 2 Continued Check Test the point (5, 32) in both inequalities. This point represents selling 5 hot dogs and 32 sausages. 2d + 2.5s ≥ 90 d + s ≤ 40 2(5) + 2.5(32) ≥ 90 5 + 32 ≤ 40 37 ≤ 40 90 ≥ 90
HW pg. 202 #’s 15, 16, 17, 20, 24, 27 HW pg. 203 #’s 25, 26, 30, 32, 39