Download

1 / 39
390 likes | 571 Vues
An Introduction to X-Ray Diffraction by Single Crystals and Powders Patrick McArdle NUI, Galway, Ireland. LATTICE ARRAYS AND BRAVAIS LATTICES. Crystalline materials differ from amorphous materials in that in the former there is

E N D
An Introduction to X-Ray Diffraction by Single Crystals and Powders Patrick McArdle NUI, Galway, Ireland pma 2010
LATTICE ARRAYS AND BRAVAIS LATTICES Crystalline materials differ from amorphous materials in that in the former there is order in the arrangement of the molecular contents whereas in the latter there is no order or at best a tendency for a short-range order. The packing of atoms, molecules or ions within a crystal occurs in a symmetrical manner and furthermore this symmetrical arrangement is repetitive. A most important common characteristic that crystals may share is the manner in which repetition occurs. This will be expressed in a common lattice array. A lattice array is constructed from the arrangement of atomic material within the crystal as follows: pma 2010
A 2-dimensional Lattice Pick any position within the 2 dimensional lattice in Fig. 1(a) and note the arrangement about this point. The chosen position can be indicated by a point (a lattice point). In view of the repetitive arrangement, there will be a 2 dimensional array of identical positions and if these are also marked by a point a 2-dimensional lattice will result if the points are joined. pma 2010
Fig. 2 Fig. 3 In a real 3-dimensional crystal lattice the same ideas apply. When crystal structures are represented by lattices, it transpires that all crystals break down into one of fourteen three dimensional lattice arrangements. Bravais demonstrated mathematically that there are only fourteen ways in which repetitive symmetry can occur and the fourteen lattices representing the ways in which repetition can occur are referred to as the Bravais lattices. UNIT CELL A unit cell can be any unit of a lattice array which when repeated in all directions, and always maintaining the same orientation in space, generates the lattice array. There is no unique way of choosing a unit cell. For example, each of the cells (A to D) in Fig. 2 are OK. However, the cell favoured by crystallographers is the one of smallest volume that displays all of the symmetry of the lattice. Thus, cells C and A are the preferred unit cells for the lattices of Figs. 2 and 3 respectively. pma 2010
c b a Orthorhombic UNIT CELL TYPES and THE SEVEN CRYSTAL SYSTEMS Cubic a = b = c. = = = 90º. Tetragonal a = b c. = = = 90º. Orthorhombic a b c. = = = 90 º. Monoclinic a b c. = = 90º, 90º. Triclinic a b c.. 90º. Rhombohedral a = b = c. = = 90 º. (or Trigonal) Hexagonal a = b c. = = 90º, = 120º. • In general, six parameters are required to define the shape and size of a unit cell, • these being three cell edge lengths (conventionally, defined as a, b, and c), • and three angles (conventionally, defined as , , and ). In the strict mathematical • sense, a, b, and c are vectors since they specify both length and direction. • is the angle between b and c, is the angle between a and c, is the angle between a and b. The unit cell should be right handed. Check the cell above with your right hand When these unit cells are combined with possible “centering” there are 14 different Bravais lattices. pma 2010
Cubic Tetragonal Orthorhombic Body Centred Cell Face Centred Cell Monoclinic I F End Face Centred Cell Triclinic C Trigonal Hexagonal Primitive Cell P Fig. 3 pma 2010
3. The fact that a unit cell meets the symmetry requirements of a crystal system does not guarantee its inclusion within the crystal system. This could result if the lattice it generated could be equally well represented by a unit cell type which is already included within the crystal system. The C-type cell for the tetragonal system (see Fig. 4) provides a good example. Four simple points on crystal lattices: 1. Every crystal system has a primitive Bravais lattice. 2. The distribution of lattice points in a cell must be such as to maintain the total symmetry of the crystal system. Thus, the cubic system cannot have a C-type cell. 4. If you repeat 3. within the orthorhombic system you will find that the primitive cell you generate will not have 90º angles. This is not orthorhombic and thus orthorhombic C is included in the crystal system. pma 2010
Orthorhombic a ≠ b ≠ c, a = b = = 90º Tetragonal a = b ≠ c, a = b = = 90º a a b b Smaller cell is Tetragonal P Angle not 90° smaller cell not orthorhombic A simplified view down c-axis can be used to illustrate points 3 and 4 pma 2010
SYMMETRY: POINT GROUP SYMMETRY AND SPACE GROUP SYMMETRY Point group theory is not dealt with here. What follows is just a summary. Point group symmetry defines the symmetry of an isolated object or group of objects, whereas space group symmetry further defines the systematic fashion in which an object, or group of objects is repeated in space to generate an infinite periodic array in 3D. Point group symmetry is quantified in terms of symmetry elements (existing within the object or group of objects) and their associated operations. Four symmetry elements are used to quantify point group symmetry Symmetry Element Symmetry Operation Rotation axis (n-fold) Rotation Mirror plane Reflection Centre of Symmetry Inversion Rotor-reflection axis (n-fold) Rotation and reflection or Rotor-inversion axis (n-fold) Rotation and inversion pma 2010
Point Group and Space Group Symmetry To generate a 3D lattice from an object it is necessary to add translational symmetry to point group symmetry. The two important space group symmetry operations which move objects are glide planes and screw axes. These operations combine translation and reflection and translation and rotation respectively. The pentagons on the left are related by simple translation. In 5(b) the pentagon on the top left of the cell is related to the one in the centre by translation a/2 followed by either reflection or rotation. Centres of inversion in 5(b) are marked with tiny circles. pma 2010
CRYSTAL SYSTEMS (7) BRAVAIS LATTICES (14) SPACE GROUPS (230) P 15 36 Cubic F 11 I 10 P 49 68 Tetragonal I 19 P 30 F 5 59 Orthorhombic I 9 C and A 15 P 8 13 Monoclinic C 5 2 Triclinic P 2 25 Rhombohedral P and R 25 27 Hexagonal P 27 Fig. 9 The 230 Space Groups There is an infinite number of combinations of the four symmetry elements. However, if there is a restriction on the order of the rotation axes to 2, 3, 4, and 6, as is the case for repetitive symmetry (crystallographic symmetry) this leaves only 32 unique combinations. These are the 32 crystallographic point groups. Adding screw axes and glide planes gives the 230 space groups. The overall breakdown of symmetry for crystals then is as shown in Fig. 9. The International Tables for Crystallography list the symmetry properties for all 230 Space Groups. The 2nd edition was in one volume and edited by Kathleen Lonsdale. The current edition runs to 7 volumes. The CSD or Cambridge Data Base is a repository for the structures of organic and organometallic compounds. Space Group determination is an important step in crystal structure determination. pma 2010
The ABSEN program within Oscail can provide Bar Charts of the contents of the Cambridge Data Base (CSD) The number of entries by crystal system Entries in the first 25 space groups pma 2010
CRYSTAL PLANES AND MILLER INDICES The use of crystal planes to describe the structure of crystals goes back to the start of crystallography and crystal planes were used by Bragg to explain diffraction as will be seen later. Crystal planes are defined by the intercepts they make on the crystal axes of the unit cell. The inverse of these fractions are the Miller Indices of the planes. In (a) the intercepts are ½, ½, 1 and the Miller Indices are (2 2 1). In (c) the intercepts on b and c are at infinity the inverse of which is 0 and the plane is the (2 0 0). In (d) the plane cuts the negative c axis at -1 and thus is (1 1 -1). In crystallography -1 is often written ī and pronounced “Bar 1”. pma 2010
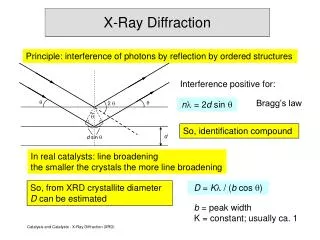
DIFFRACTION AND THE BRAGG EQUATION Max von Laue was the first to suggest that crystals might diffract X-rays and he also provided the first explanation for the diffraction observed. However, it is the explanation provided by Bragg that is simpler and more popular. In the Bragg view crystal planes act a mirrors. Constructive interference is observed when the path difference between the two reflected beams in (a) = nl. The path difference in (a) is 2my. Since my/d = sin 2my = 2dsin = nl where d is the interplanar spacing. pma 2010
Bragg’s Law animated In (a) above it is clear that the planes are the (1,0,0) set of planes. If the path difference is simply one wavelength the Bragg condition can be stated as This is a first order reflection. If the path difference is two wave lengths the Bragg condition becomes and the reflection is a second order reflection. pma 2010
SOLVING A CRYSTAL STRUCTURE BY SINGLE CRYSTAL DIFFRACTION TECHNIQUES N.B. The crystal must be a single crystal. Bragg's equation specifies that, if a crystal is rotated within a monochromatic X-ray beam, such that every conceivable orientation of the crystal relative to the beam is achieved, each set of planes will have had the opportunity to satisfy the Bragg equation and will have given rise to reflection. In order to solve a crystal structure it is necessary to record a large number of reflections. This implies accurately measuring their intensities and recording their directions with respect to crystal orientation and initial X-ray beam direction. Many experimental techniques have been devised to achieve this. The steps involved in a crystal structure determination are summarised in the flow chart. pma 2010
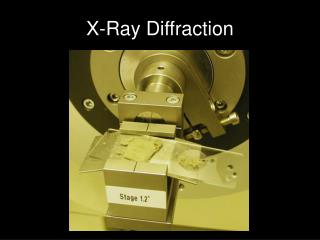
Diagram Of An Area Detector X-Ray Data Collection System. The first crystallographic data collection systems used photographic methods. These were replaced by automateddiffractometers which measuredreflections one at a time. A typical data collection took several days. modern systems use area detectors which measure 100s at a time. The crystal is oscillated over < 2° while an image is collected then rotated by the same amount and oscillated again. The process is repeated over a total range of about 180°. Each image is exposed for < 100s. Thus if readout time is ignored total data collection time is often < 3 hr. A typical image shown to the left. A computer program is used to predict the unit cell from several images. pma 2010
Determination of the Lattice type and Space Group High symmetry can lead to reflections being systematically absent from the data set. Absent reflections have no measurable intensity. There are two types of absences, General Absences and Special Absences. The general absences determine the lattice type; Primitive (P) has no general absences and no restrictions on h, k or l. End Cantered (C) h+k=2n+1 are all absent. Face Cantered (F) only h, k, l, all even or all odd are observed. Body Cantered (I) h+k+l=2n+1 are all absent. The special absences refer to specific sets of reflections and are used to detect the presence of glide planes and screw axes. Some Space Groups are uniquely determined by special absences but in many cases several Space Groups will have to be considered. Computer programs are able to lay out the data in tables with absences indicated and possible Space Groups can be suggested however the choice of Space Group will often need much thought. pma 2010
Reflection Analysis I/I Cut1 Cut2 Cut3 = 3.0 6.0 12.0 Group Cond. Op. All Odd Cut1 Cut2 Cut3 Op. No. h00 h=2n+1 21.. 18 10 8 8 8 1 0k0 k=2n+1 3 1 1 0 0 .21. 2 00l l=2n+1 11 6 0 0 0 ..21 3 0kl k=2n+1 b.. 95 53 49 44 37 4 0kl l=2n+1 c.. 49 43 40 33 5 0kl k+l=2n+1 n.. 40 34 30 28 6 h0l h=2n+1 .a. 412 211 96 89 81 7 h0l l=2n+1 211 1 1 0 .c. 8 h0l h+l=2n+1 .n. 212 95 88 81 9 hk0 h=2n+1 ..a 168 84 67 60 49 10 hk0 k=2n+1 ..b 84 76 69 48 11 hk0 h+k=2n+1 ..n 86 71 69 55 12 hkl k+l=2n+1 A.. 1591 1196 1084 902 13 hkl h+l=2n+1 .B. 1638 1271 1151 915 14 hkl h+k=2n+1 ..C 1651 1285 1145 921 15 hkl h+k+l=2n+1 I 1637 1288 1148 943 16 hkl not all odd/even F 2440 1876 1690 1369 17 P21/c (14) CSD Total for all SGs at end of 2006 385035 In this case P21/c is the only choice offered by Oscail and this is likely to be correct. Notice the symmetry operations move to the right when present in the data. pma 2010
Solving the Structure The unit cell, the Space Group and the reflection intensities cannot be used to generate the structure as there is no reflection phase information in the data set. This is the phase problem. If the reflection phases were known then an electron density map could be calculated using a Fourier series. If (x,y,z) is the electron density at x,y,z then The F here is the square root of the measured intensity When intensity is measured it is measured without sign and the phase is lost. • There are two ways to solve the phase problem: • The Patterson or heavy atom method • Direct Methods (Hauptman and Karle 1985 Nobel prize) • The Charge flipping method is a recent development pma 2010
Direct Methods After many years of study statistical trends were observed in reflection phases. It was also observed that some reflections are more important than others. The Direct Methods approach tries to guess the reflection phases and then awards a Figure of Merit to the guess. The most popular is the Combined Figure of Merit or CFOM). It is normal practice to accept solutions with CFOM values in the range 0.03-0.15 and to try to use these phases to generate an electron density map. The Patterson or heavy atom method. It is the electrons that scatter X-rays. Atoms that are heavier than all others in the crystal will give rise to the strongest reflections. Heavy is a relative term however, all atoms after Rb are normally considered to be heavy. Iodine for example will scatter a lot of X-rays compared to carbon. Using the Patterson method it should be possible to calculate the position of an iodine atom and this could be used to phase most of the reflections and calculate an electron density map. Charge Flipping The charge flipping method works well if the data has good resolution. There is an example in the Oscail tutorials. All non-H atoms are often identified correctly in the solution. pma 2010
Refining a Structure It should be possible to “see” atoms in an electron density map if it has good resolution i.e. at least 1Å resolution. The steps in refining a structure are. 1. Use whatever atoms you have that look OK to generate an electron density map. 2. The known atoms are subtracted from this to generate a difference map. 3. Any atoms that have been missed should be in the difference map. 4. The refinement process minimises the difference between observed and calculated reflection intensities. 5. In the final difference map there should be no peaks larger than a H atom i.e. > 1e/Å3. (A H atom has a volume of about 1Å3 and has 1 e.) Resolution The resolution of a crystal structure is usually quoted in Angstroms, Å. Standard small molecule structures should always be at least of 1 Å resolution to give accurate bond lengths. Resolution can be related to Bragg angle at any wavelength through the Bragg equation n = 2d sin. Using the value of the reflection with the largest Bragg angle in a data set then d = l/2sin gives the resolution. The pattern shown on slide 15 has a resolution of 0.98Å at the edge. pma 2010
Anisotropic refinement of the non-hydrogen atoms – In the early stages atoms are refined as if they were spheres. Since atoms vibrate in a way that is controlled by chemical bonds and interactions with their neighbours, it is better to refine then as ellipsoids. One parameter (the radius) is enough to define a sphere this with x,y,z means that isotropic refinement requires 4 parameters per atom. An ellipsoid needs 6 parameters thus an anisotropic atom requires 9 parameters. This is an example of an anisotropic atom Final stages of refinement. There are many was in which a structure can be “improved”. The two most important considerations are addition of hydrogen atoms and anisotropic refinement of the non-hydrogen atoms. Addition of hydrogen atoms – Hydrogen atoms have only 1 electron and are often not seen in difference maps. It is best to include them at calculated positions. This is easy to do and it will improve the “R factor”. R Factor – The R factors used are Rw and wR2. Rw should be < 8% and wR2 should be <15%. The lower the better. If the R or error is greater then these values the structure is not much use. Rs are of the form Sum[(I0-Ic)/Io] pma 2010
Problems with X-ray Crystallography Locating Hydrogen atoms - Hydrogen atoms make extremely small contributions and for this reason X-ray crystallography is not a good technique for accurately locating hydrogen atom positions. If the location of hydrogen atoms is of specific interest (e.g. in the study of hydride structures and hydrogen bonding interactions) use has got to be made of the much more expensive and less available technique of neutron diffraction. The theory of neutron diffraction is very similar to that for X-ray diffraction but an essential difference is that hydrogen atoms scatter neutrons as effectively as many other atoms and for this reason they can be located with good accuracy in the structure determination. The Need for Single Crystals - In order to carry out a detailed X-ray structure determination, it is essential to have a crystal of the material in question. Many compounds cannot be crystallised and thus are not amenable to diffraction studies. There are also commercially important materials such as glasses and many ceramics which owe their unique properties to their amorphous nature. Being amorphous (no long range order), the structures of these materials cannot be investigated in detail by diffraction techniques. Low Temperature Structure Determination – When X-ray data are collected at low temperature (<-150 ºC) thermal ellipsoids are smaller and better defined. N.B. bond lengths show very little variation with temperature. pma 2010
POWDER X-RAY DIFFRACTOMETRY A crystalline powder sample will diffract X-rays but since the orientations of the individual crystals are random the data set produced is a plot of intensity v.s. diffraction angle or Bragg angle . Here the sample is sitting on a flat plate and the plate is turned about the centre of the diffractometer at half the rate through which the counter moves. This is the /2 or Bragg scan method. Notice the plot contains 2 on the X-axis and X-ray intensity on the y-axis. pma 2010
Uses of X-ray Powder Diffraction In general, powder diffraction data are unsuitable for solving crystal structures. Some advances have recently been made using the Rietveld method. However this is far from trivial and it works best in relatively simple cases. It is very difficult to be sure that the unit cell is correct as the reflections overlap and are difficult to resolve from one another. Important advantages and uses of powder diffraction: 1. The need to grow crystals is eliminated. 2. A powder diffraction pattern can be recorded very rapidly and the technique is non-destructive. 3. With special equipment very small samples may be used (1-2mg.) 4. A powder diffraction pattern may be used as a fingerprint. It is often superior to an infrared spectrum in this respect. 5. It can be used for the qualitative, and often the quantitative, determination of the crystalline components of a powder mixture. 6. Powder diffractometry provides an easy and fast method for the detection of crystal polymorphs. Powder patterns are provided when a drug is being registered with the FDA. (Polymorphs are different crystal forms of the same substance.) pma 2010
Calculations using X-ray powder diffraction patterns. For an orthogonal system (a = b = = 90°) the relationship between interplanar spacing (d) and the unit cell parameters is given by the expression: This is the expression for an orthorhombic crystal. For the tetragonal system it reduces to and, for the cubic system, it further reduces to pma 2010
In the CsCl structure both ions have coordination numbers of 8 and the structure is a simple primitive one with no centring. Formula Cs at centre = 1 8 x 1/8Cl = 1 = CsCl Important Cubic Lattice Types Two of the most important cubic lattice types are the NaCl type and the CsCl type. NaCl crystallizes in the Space Group Fm-3m Stoichiometry (formula) from the Unit Cell Site Na+ Cl- Central 0 1 Face 6/2 0 Edge 0 12/4 Corner 8/8 0 Total 4 4 pma 2010
Cubic close packed spheres The unit cell of a cubic close packed Metal has a face cantered or F type lattice The formula of the unit cell is: 6 x ½ + 8 x 1/8 = 4 pma 2010
The Bragg equation may be rearranged (if n=1) from to If the value of 1/(dh,k,l)2 in the cubic system equation above is inserted into this form of the Bragg equation you have Since in any specific case a and l are constant and if l2/4a2 = A pma 2010
ANALYSIS OF X-RAY POWDER DIFFRACTION DATA Diffraction data have been collected on a powder diffractometer for a series of compounds that crystallise in the cubic system. In the practical course each person will calculate the unit cell parameter and density from an X-ray powder diffraction pattern. Question 1 Aluminium powder gives a diffraction pattern that yields the following eight largest d-spacings: 2.338, 2.024, 1.431, 1.221, 1.169, 1.0124, 0.9289 and 0.9055 Å. Aluminium has a cubic close packed structure and its atomic weight is 26.98 and l = 1.5405 A . Index the diffraction data and calculate the density of aluminium. can be used to obtain sin, The Bragg equation, The ccp lattice is an F type lattice and the only reflections observed are those with all even or all odd indices. that are allowed Thus the only values of sin2 in are 3A, 4A , 8A, 11A, 12A,16A and 19A for the first eight reflections. pma 2010
Insert the values into a table and compute sin and sin2. Since the lowest value of sin2 is 3A and the next is 4A the first Entry in the Calc. sin2 column is (0.10854/3)*4 etc. The reflections have now been indexed. pma 2010
Calculation of a For the first reflection (for which h2 + k2 + l2 = 3) sin2 = 3A = 3 ( l2 / 4a2 ) a2 = 3l2 / 4sin2 a = 4.04946 Å = 4.04946 x 10⁻⁸ cm. Calculation of the density of aluminium a3 = 66.40356 Å3 = 66.40356 x 10⁻²⁴ cm3. If the density of aluminium is r (g. cm.-3), the mass of the unit cell is x 66.40356 x 10⁻²⁴ g. The unit cell of aluminium contains 4 atoms. The weight of one aluminium atom is 26.98/(6.022 x 1023) = 4.48024 x 10⁻²³ and the weight of four atoms (the content of the unit cell) is 179.209 x 10⁻²⁴. r x 66.40356 x 10-24 = 179.209 x 10⁻²⁴ p = 2.6988 g.cm-3. pma 2010
The X-ray powder diffraction pattern of AgCl obtained using radiation of wavelength 1.54Å is shown below. The peaks are labelled with 2θ values • Answer each of the following. • On the basis that the structure is cubic and of either the NaCl or CsCl type • 1. Index the first six reflections. [15 marks], 2. Calculate the unit cell parameter.[5 marks], 3. Calculate the density of AgCl. [5 marks] • (Assume the following atomic weights: Ag, 107.868; Cl, 35.453; • and Avogadro’s number is 6.022 x 10²³) pma 2010
Since values are available sin2 values can be calculated and inserted in a table. From Sin2 = A(h2 + k2 + l2) the possible values are: 1. for a face centred lattice 3A, 4A , 8A, 11A, 12A and 16A 2. for a primitive lattice 1A, 2A, 3A, 4A, 5A and 6A The second option is not possible as the first 2 are not in the ratio of 1:2. To test the first option, divide the first by 3 and multiply the result by 4, 8 etc. pma 2010
Density of AgCl Since sin2 = l2(h2 + k2 + l2)/4a2 a2 = (1.54)2.(16)/4(0.3083) using the largest (most accurate) 2 a2 = 30.7692 a = 5.547Ǻ (1Ǻ=10-8 cm) Formula wt. of unit cell = 4AgCl = 573.284g This is the weight of 4 moles of AgCl. The weight of 4 molecules is 573.284 / (6.02 x 10²³) Density = 573.284 / (6.02 x 10²³)(5.547 x 10⁻⁸)3 A is in Ǻ thus the answer should be multiplied by 1 / 10-24 Density= 5.580 g/cm3 pma 2010
Preferred Orientation Effects in X-ray Powder Diffraction Patterns It is possible to calculate the theoretical diffraction pattern if the crystal structure is known. Nifedipine Calculated pattern Observed pattern There are no preferred orientation effects here as all reflections have their expected intensity. pma 2010
002 004 There is clear preferred orientation here. The 002 is the flat face exposed when the needles lie down on a flat plate. Benzoic acid Calculated pattern Observed pattern pma 2010
Some points relating to preferred orientation effects. • Preferred orientation effects are often observed for needles and plates. • Preferred orientation effects can be reduced by sample rotation etc. • However it is possible to obtain useful information when a stationary flat • sample holder is used without rotation and when preferred orientation • effects are at a maximum. • If deviations from a theoretical pattern are measured they may be used • to monitor the morphology (shape) of crystals in a production batch. pma 2010