Download
1 / 59
590 likes | 600 Vues
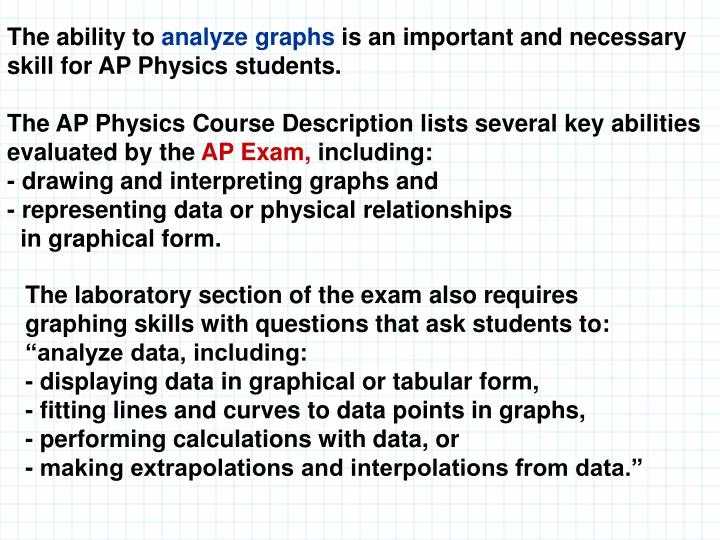
The ability to analyze graphs is an important and necessary skill for AP Physics students. The AP Physics Course Description lists several key abilities evaluated by the AP Exam, including: - drawing and interpreting graphs and - representing data or physical relationships

E N D
The ability to analyze graphs is an important and necessary skill for AP Physics students. The AP Physics Course Description lists several key abilities evaluated by the AP Exam, including: - drawing and interpreting graphs and - representing data or physical relationships in graphical form. The laboratory section of the exam also requires graphing skills with questions that ask students to: “analyze data, including: - displaying data in graphical or tabular form, - fitting lines and curves to data points in graphs, - performing calculations with data, or - making extrapolations and interpolations from data.”
PROBLEM AREAS IN GRAPHICAL ANALYSIS There are various broad categories under the general area of graphical analysis. - Many students have trouble with data plotting, seemingly because they do not understand the fundamentals of graphing and what a graph means. They have difficulty choosing the variables to plot, indicating on the graph what they have plotted, and labeling the correct units. They have difficulty making scales uniform and drawing graphs that may not include the zero on one or both axes if these zeros are not part of the data set. This should not be a problem for you. You are probably comfortable making basic graphs.
- A second area where students struggle is linearizing data. Students appear to have trouble deciding how to plot a relationship so that a best fit to the data can give information from the slope and the intercept. Many students connect the dots; many choose two data points that are not on the best-fit line or use one point and an inappropriate zero to find a slope; many draw a straight line through data uncritically, even when such a fit is not appropriate; and many choose two points very close together and ignore the full data set when finding a slope. The ability to linearize data requires a good understanding of functions.
Linearization This area spans all topics in physics and requires a good conceptual and mathematical understanding of the underlying physics. Students should be able to interpret and linearize graphs and make predictions. Physics for dummies: Linearizing a graph means to adjust the variables so that a curved graph turns into a straight-line graph.
Common Graph Forms in Physics More common form: Y = mX + b - Linear Graph (Write down the following graph forms and equations of the line, learn them)
Common Graph Forms in Physics Inverse graph Y = A (1/X)
Common Graph Forms in Physics Y Inverse-square graph Y = A (1/X2)
Common Graph Forms in Physics Double Inverse graph 1/Y = 1/X + 1/A
Common Graph Forms in Physics Power Graph Y = mX2 for freefalling bodies, the slope, m = 1/2g
The significance of “linearizing” data When data are non-linear, it is best to “linearize” the data. This does not mean to fit the curved data points with a straight line. Rather, it means to modify one of the variables in some manner such that when the data are graphed using this new data set, the resulting data points will appear to lie in a straight line.
Parabola Equation: y = mx2 The graph below depicts the velocity of a steel ball that rolls down an incline. (Power Relationship) From the graph we can see that the displacement of the steel ball varies directly with the square of the time. d = mt2
The acceleration of the ball can be found by calculating the slope of the line: The equation of the curve becomes: y = mx2
Hyperbola Equation: The following graph shows data from an experiment designed to verify Boyle's Law. (Inverse Relationship) The graph shows an inverse relationship between the pressure and the volume.
To linearize the graph we plot Vvs. 1/P to obtain a straight line with a slope that proves that PV = constant
Quantum Number n |Energy| (eV) 1 13.6 2 3.4 3 1.5 4 0.8 5 0.5 6 0.3 7 0.2 EXERCISE 1. 2003bC2 (slightly modified, they gave you one of the graphs) The data from an experiment of the spectral lines of the hydrogen atom is given on the table below. Derive an equation in terms of the energy and the quantum numbers for the hydrogen atom.
EXERCISE 1. Quantum what's? I don't know what the heck they are talking about! It doesn't matter, on the AP exam, you may have no clue what they are talking about, however, this problem can be done without knowing any information about atomic physics, simply analyze the data using a graph.
Quantum Number n |Energy| (eV) 1 13.6 2 3.4 3 1.5 4 0.8 5 0.5 6 0.3 7 0.2 EXERCISE 1. 2003bC2 (slightly modified, they gave you one of the graphs) The data from an experiment of the spectral lines of the hydrogen atom is given on the table below. Derive an equation in terms of the energy and the quantum numbers for the hydrogen atom. Make a graph. What graph form is it? Inverse: Y = A/X , or in this case, E = A/n
The graph below is obtained: The graph suggests that the energy varies inversely with the quantum number, therefore, we need to linearize the graph using... E vs. 1/n to obtain the following graph.
Is this linearized? NO What graph form is it? Power Relationship Y = AXB More specifically, Y = mX2 E = m (1/n)2 How do we linearize this? Graph E vs (1/n)2
From the graph we see that the energy varies with the inverse of the square of the quantum number. Doing a second linearization the graph of E vs.1/n2 should yield a straight line:
We can now use the graph to find the slope: y = mx + b What is X? (1/n)2 You have just derived the equation for the energy of any electron state in the H atom!
2006bB1..A student wishing to determine experimentally the acceleration gdue to gravity has an apparatus that holds a small steel sphere above a recording plate, as shown above. When the sphere is released, a timer automatically begins recording the time of fall. The timer automatically stops when the sphere strikes the recording plate. The student measures the time of fall for different values of the distance Dshown above and records the data in the table below. These data points are also plotted on the graph.
(a) On the grid above, sketch the smooth curve that best represents the student’s data.
The student can use these data for distance D and time t to produce a second graph from which the acceleration g due to gravity can be determined. (b) If only the variables D and t are used, what quantities should the student graph in order to produce a linear relationship between the two quantities?
(c)On the grid below, plot the data points for the quantities you have identified in part (b), and sketch the best straight-line fit to the points. Label your axes and show the scale that you have chosen for the graph.
d. Using the slope of your graph in part (c), calculate the acceleration g due to gravity in this experiment. g = 2(4.9) = 9.8 m/s2
e. State one way in which the student could improve the accuracy of the results if the experiment were to be performed again. Explain why this would improve the accuracy. Do several trials for each value of d and take averages. This reduces personal and random error.
2002B2. A 3.0 kg object subject to a restoring force F is undergoing simple harmonic motion with a small amplitude. The potential energy U of the object as a function of distance x from its equilibrium position is shown above. This particular object has a total energy E: of 0.4 J.
(a)What is the object's potential energy when its displacement is +4 cm from its equilibrium position? From graph U = 0.05 J
(b)What is the farthest the object moves along the x‑axis in the positive direction? Explain your reasoning. From graph the total energy is 0.4 J, this corresponds to x = 10 cm The maximum gravitational energy cannot be greater than the total energy
(c)Determine the object's kinetic energy when its displacement is ‑7 cm. From graph: U = 0.2 J K = TE – U = 0.4 –0.2 = 0.2 J
(d)What is the object's speed at x = 0 ? K = 0.4 J = 0.5 m/s
(e) Suppose the object undergoes this motion because it is the bob of a simple pendulum as shown. If the object breaks loose from the string at the instant the pendulum reaches its lowest point and hits the ground at point P shown, what is the horizontal distance d that it travels? = 0.32 s x = vx t = 0.5 m/s (0.32 s) = 0.15 m
Frequency (Hz) Maximum Kinetic Energy of Electrons (eV) 0.5 x 10¹⁵ No electrons ejected 1.0 x 10¹⁵ 1.0 1.5 x 10¹⁵ 3.0 2.0 x 10¹⁵ 5.0 1980B3. In a photoelectric experiment, radiation of several different frequencies was made to shine on a metal surface and the maximum kinetic energy of the ejected electrons was measured at each frequency. Selected results of the experiment are presented in the table below:
a.On the axes below, plot the data from this photoelectric experiment.
b.Determine the threshold frequency of the metal surface. x-intercept = 0.75x10¹⁵ Hz
c. Determine the work function of the metal surface. y-intercept = 3 eV
d.When light of frequency 2.0 x 10¹⁵ Hz strikes the metal surface, electrons of assorted speeds are ejected from the surface. What minimum retarding potential would be required to stop all of the electrons ejected from the surface by light of frequency 2.0 x 10¹⁵ Hz? If f =2x10¹⁵ Hz, KEmax= 5 eV Vmin= 5 eV/e = 5 V
2006 B4 A student performs an experiment to determine the index of refraction n of a rectangular glass slab in air. She is asked to use a laser beam to measure angles of incidence θiin air and corresponding angles of refraction θr in glass. The measurements of the angles for five trials are given in the table below.
a.Complete the last two columns in the table by calculating the quantities that need to be graphed to provide a linear relationship from which the index of refraction can be determined. Label the top of each column.
b.On the grid below, plot the quantities calculated in (a) and draw an appropriate graph from which the index of refraction can be determined. Label the axes.
c. Using the graph, calculate the index of refraction of the glass slab. = 1.5
2005 B6 An experiment is performed to determine the number n of moles of an ideal gas in the cylinder shown. The cylinder is fitted with a movable, frictionless piston of area A. The piston is in equilibrium and is supported by the pressure of the gas. The gas is heated while its pressure P remains constant. Measurements are made of the temperature T of the gas and the height Hof the bottom of the piston above the base of the cylinder and are recorded in the table below. Assume that the thermal expansion ofthe apparatus can be ignored.
a.Write a relationship between the quantitiesTandH, in terms of the given quantities and fundamental constants, that will allow you to determinen. and
b. Plot the data on the axes below so that you will be able to determinenfrom the relationship in part (a). Label the axes with appropriate numbers to show the scale.
c. Using your graph and the values A = 0.027 m2 and P = 1.0 atm, determine the experimental value of n. n = 1.11 moles