Download
1 / 16
160 likes | 268 Vues
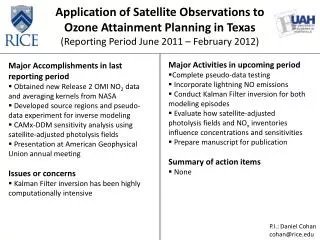
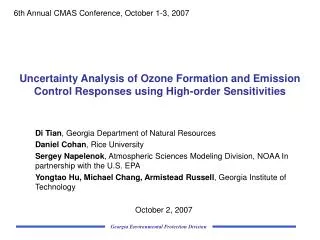
6th Annual CMAS Conference, October 1-3, 2007. Uncertainty Analysis of Ozone Formation and Emission Control Responses using High-order Sensitivities. Di Tian , Georgia Department of Natural Resources Daniel Cohan , Rice University

E N D
6th Annual CMAS Conference, October 1-3, 2007 Uncertainty Analysis of Ozone Formation and Emission Control Responses using High-order Sensitivities Di Tian, Georgia Department of Natural Resources Daniel Cohan, Rice University Sergey Napelenok, Atmospheric Sciences Modeling Division, NOAA In partnership with the U.S. EPA Yongtao Hu, Michael Chang, Armistead Russell, Georgia Institute of Technology October 2, 2007 Georgia Environmental Protection Division
Overview • Source oriented air quality modeling (AQM) • Uncertainty analysis – Monte Carlo method • Reduced form AQM based on first and high-order sensitivities • Case study • Projected air quality during 2007 in the southeastern U.S. • Three base episodes: 8/1 – 8/15/1999, 8/11 – 8/19/2000, 7/5 – 7/17/2001 • Uncertainties in simulated ozone concentrations • Uncertainties in simulated ozone reduction from emission controls Georgia Environmental Protection Division
Emissions Air Quality Model Chemistry Meteorology Source-oriented Air Quality Modeling • Meteorology (MM5): Surface, PBL, Cumulus, Explicit Moisture Scheme, one-way nesting, FDDA, etc. • Emission processing (SMOKE v2.1): Temporal, spatial, speciation • Air quality model (CMAQ v4.3): Advection, diffusion, chemistry, cloud, deposition, etc Georgia Environmental Protection Division
How reliable is air quality modeling? Uncertainty Analysis – Monte Carlo Method Quantify uncertainties and provide information to policy makers Concentrations Emissions Ozone (grid, time-step) Stationary Point NOX Simulation 1 Simulation 2 Simulation 3 . . . Simulation N Probability distribution mean,std,cov=std/mean,C97.5, C50, C2.5 Source Oriented AQM Mobile NOX Biogenic VOC N Runs Anthropogenic VOC Computationally Expensive!!! If one AQM run takes 10hr, 1000 runs x 10hr/run = 10,000hrs For 10 types of emissions controls, 10,000hrs x 10 = 100,000hrs Georgia Environmental Protection Division
Reduced-Form Ozone AQM (RFAQM) • Ozone sensitivities to different emission sources • Provide detailed insight into complicated responses • First and second-order sensitivities (Hakami, 2004 and Cohan, 2005) • Vary in Space and time • CMAQ-DDM: Decoupled Direct Method • Calculate sensitivities/responses of gas and aerosol phase concentrations to emission changes together with concentrations • Computationally efficient • Source apportionment and control strategy development Nonlinear ozone response to emissions Taylor expansions: Georgia Environmental Protection Division
Air Quality Modeling - FAQS Fall Line Air Quality Study http://cure.eas.gatech.edu/faqs/index.html Three Episodes: based on CART analysis 8/1 – 8/15/1999 8/11 – 8/19/2000 7/5 – 7/17/2001 Model Performance Statistics Georgia Environmental Protection Division
Projected Air Quality in 2007 1999 2007_1999 • Emissions in 2007: • Growth factor: EGAS • Controls: NOX SIP call, VOC RACT and MACT, etc Domain-wide daily NOX and VOC emissions during 2007 (tons per day) Georgia Environmental Protection Division
2E E/2 E Emission Uncertainties • Expert elicitation (Hanna, 2001) • Log-normal distributions • 95% CI: (nominal / factor, nominal x factor) • Point source: Factor of 1.5 • Other sources: Factor of 2 • Non-road mobile emission uncertainties (Chi, 2004) • NOX emissions: Factor of 1.6 • VOC emissions: Factor of 1.5 • Biogenic emission uncertainties using BEIS3 (Hanna, 2005) • Qualitative uncertainties • NARSTO emission inventory assessment, 2005 Georgia Environmental Protection Division
Uncertainties in Ozone Simulations (1) Emission uncertainties, 95% CI Stationary point NOX emissions: factor of 1.5 Non-point NOX emissions (onroad and nonroad mobile, area): factor of 2 Biogenic VOC: factor of 2 Anthropogenic VOC: factor of 2 Daily peak 8-hour ozone concentrations (ppb) and 95% CI Downtown Atlanta, Georgia, base year 1999 Georgia Environmental Protection Division
Uncertainties in Ozone Simulations (2) Scatter plots for 95% CI Summary by different base years 1999 Cut-off = 40 ppbv, error bar refers to variability in such ratios, 95% range Georgia Environmental Protection Division
Emission Control Responses Nonlinear ozone response to emissions Ozone concentrations when emissions are reduced by a factor femis Ozone reduction (ppb) Ozone reduction per unit emissions (ppt/tons per day) Control efficiency (%) Georgia Environmental Protection Division
Uncertainties in Emission Control Responses (1) Nonlinear ozone response to emissions Random emissions Pj Ozone responses to controls of Atlanta point source emissions Ozone reduction (ppb) Ozone reduction (ppt/tpd) Control efficiency (%) Peak 8-hr ozone, base year 1999, Downtown Atlanta, Georgia Georgia Environmental Protection Division
Uncertainties in Emission Control Responses (2) Nonlinear ozone response to emissions Random emissions Pj Ozone responses to controls of Atlanta onroad mobile source emissions Ozone reduction (ppb) Ozone reduction (ppt/tpd) Control efficiency (%) Peak 8-hr ozone, base year 1999, Downtown Atlanta, Georgia Georgia Environmental Protection Division
Ozone Reduction (ppb) base year 1999, cutoff = 80ppb Atlanta Point Outside Atlanta Point Atlanta Mobile Onroad Atlanta Mobile Nonroad Georgia Environmental Protection Division
Summary of Uncertainties in Emission Control Responses: base year 1999 Ozone reduction (ppb) Ozone reduction (ppt/tpd) Control efficiency (%) Percents of 95% CI overlapping 0 Georgia Environmental Protection Division
Summary • RFAQM developed using first and second order ozone sensitivities • Computationally efficient for detailed uncertainty analysis • Uncertainties in ozone simulations • Easily redo for different emission uncertainties • Uncertainties in emission control responses • Don’t need to rerun AQM for different emission controls • Large nonlinear relationships of ozone to mobile source emissions • Emission controls can lead to increased ozone concentrations • Future work • Incorporate cost-benefit analysis $$$, evaluate their associated uncertainties Georgia Environmental Protection Division