Download
1 / 20
200 likes | 312 Vues
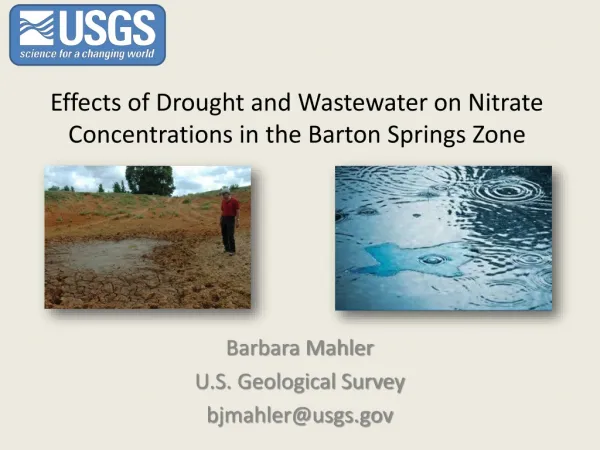
Morro Basin Municipal Well Nitrate Contamination Sources Resident Group Request for Board Intervention and Action May 22, 2014.

E N D
Morro Basin Municipal Well Nitrate Contamination Sources Resident Group Request for Board Intervention and Action May 22, 2014 Purpose:Request the Board’s assistance in resolving a disagreement between RWQCB staff and a group of Morro Bay residents. The issue is the source of nitrate contamination of Morro Basin municipal wells RWQCB staff position: Primary contamination source is fertilizer used in Morro Valley Resident group position: Primary contamination source is sewage leaking from Morro Bay’s Main Street sewer trunk lines Objectives: • Productive dialog between RWQCB and residents • Testing of groundwater around trunk lines for evidence of leaking sewage • Mandated repair of Main Street trunk lines Content: • General background material and evidence supporting residents’ position (slides 2 through 10) • Specific issues and evidence related to disagreement between RWQCB staff and residents(Slides 11 through 19) • Selected References (Slide 20 )
History of Nitrate Concentrations in Morro Basin Well 03 • Records kept since 1954 • Prior to 2002, nitrate mcl never exceeded • November spikes began in 2002 and continue to present • “Historically, nitrate concentrations in November were in decline, rather than peaking”
Link to Well Production • “The pattern of fluctuations, however, appears linked to well field production.” Morro Basin Nitrate Study • No changes in farming practice or acreage can account for sudden onset of November spikes
Most likely cause of nitrate spikes beginning in 2002 San Luis Obispo Tribune, February 14, 2001 SHELL WILL CLEAN UP MTBE IN MORRO:$2.3 MILLION SETTLEMENT CALLED 'A TOTAL VICTORY' “The settlement calls for Shell to: Clean up the MTBE in the Morro Creek ground-water basin and making sure contamination does not reach the city's four drinking water wells, located some 500 feet west of the station. The state Health Agency ordered the city not to use the Morro Creek wells unless in an emergency to prevent drawing the contamination through the basin toward them.” • 1997, Morro Bay switched from well to State water • 1998, MTBE was found in shallow groundwater; well use was then suspended • 2001, Remediation work began • November, 2002, Use of wells recommenced, and nitrate levels in wells exceeded mcl for the first time
Scope of Remediation Work • Extensive excavations at gasoline station site • Total of 63 extraction and monitoring wells drilled
Remediation site in relation to aquifer and wells • Major excavations done directly over aquifer boundary • Extraction and monitoring wells drilled into aquifer
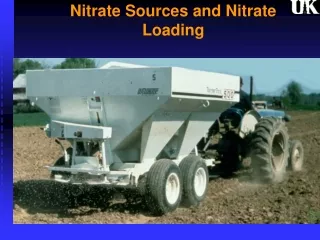
Probable primary source of nitrate contamination • Two gravity sewer trunk lines run along Main Street and past remediation site • Gravel “bedding” material in sewer line trenches potential conduit for exfiltrated sewage
Shared Main Street trunk line exfiltration potential Example, Alva Paul Creek to Sequoia, manhole 1 → 3 From 2007 review of inspection video of shared Main Street trunk line - line section between manholes 1 and 3. (Review done by CWEA grade 4 collection systems expert): • 61 offset joints, some severe (1 a sunken main) • 6 separated joints • 5 joints with separation and offset • 9 Cracks, most are severe • 4 bellies • 1 manhole with pan missing
Pertinent expert commentary: Amick and Burgess “At a pressure head below the sewer crown, which is typically the case in gravity flow sewer lines, exfiltration rates were minimal. At a pressure head of one pipe diameter, the exfiltration rate increased dramatically, to more than 26 gal/hour (gph) per joint in some segments. This high leakage rate can, in part, be attributed to the generally poor condition of the old sewer systems. A linear correlation between pressure head and exfiltration rate for several types of sewer defects was noted for pressure heads greater than 500 mm (20 inches). It was also noted that at lower flows and pressure heads, the exfiltration rate decreases exponentially, most likely from self-sealing from sewer film and settleable solids in the sewage. If the flow and pressure head increases, however, this self-sealing property is broken and the exfiltration rate increases rapidly.” Material quoted from: “Exfiltration in Sewer Systems”, a study done in 2000 for the EPA - by Amickand Burgess
Significant pattern of nitrate levels in the wells • Well 03 is closest to the Main Street sewer trunk line and remediation site • Well 04 is next-closest • Well 14 is third-closest • Well 15 is farthest away • Morro Bay Mutual Water wells have radically-lower nitrate levels • Water drawn by all wells comes from the Morro Valley through the “narrows”.
Issues for which responses are requestedIssue #1: Isotopic analysis of nitrogen and due diligence RWQCB staff: Morro Bay-funded isotopic study demonstrated due diligence in investigating potential nitrate sources Our Concerns: • Consultant failed to collect and test samples of nitrates from the two suspected sources, and to compare the isotopic signatures of nitrates in those samples to the isotopic signatures of the nitrates found in the wells. • Isotopic signatures (15N/14N) of the nitrates in the wells are consistent with those of sewage and inconsistent with those of fertilizer. Example - McQuillanStudy Values: SourceNitrate signature Septic systems: 7.6 to 12.1 Sewage treatment plant: 7.2 to 12.1 Morro Basin wells: 7.1 to 10.0 Standard range for Commercial Fertilizer - 4 to + 4
Issues for which responses are requestedIssue #2: Tests for other components of wastewater RWQCB staff: Piper diagrams* in City-funded study demonstrate that wastewater is not a significant component of the water produced and therefore exfiltration is not likely a source of nitrogen/nitrate Our Concerns: • Dates on laboratory reports demonstrate that samples used for testing for other components of sewage were drawn when nitrate levels in the wells were low • To determine if high nitrates are from sewage, samples to test for other components of sewage should be drawn when nitrates are high. * “Piper diagrams show the relative concentrations of six to seven ions in solutions … The Piper diagram includes two trilinear diagrams, one for anions (on the lower right) and one for cations(on the lower left). For each sample, the information from each trilinear diagram is projected up into the central quadrilateral. Therefore, each sample will plot in each frame of the Piper, once representing cations, once representing anions, and once representing the combination.” Quoted from paper by AECOM Environment
Issues for which responses are requestedIssue #3: Morro Valley and Well Water Nitrate Concentration Changes RWQCB staff: City-funded study demonstrated the change in nitrate concentrations, over time, in the lower Morro Valley groundwater and groundwater produced from the supply wells - and shows that there is a direct and measurable correlation between nitrate increases in the Morro Valley and nitrate in the well water Our Concerns: • Comparison of nitrate levels in different years was made between samples drawn in December, 1980 and samples drawn in the summer of 2007. This ignores seasonal patterns in use of fertilizer. Samples should be from same month. • Study failed to account for the following potential variables . o specific location(s) of sampling– same wells used in 1980 and 2007? o activities in the locations immediately prior to sampling, o usage of the areas and possible changes in that usage over time. • Study did not account for any changes in farming operations that would account for the sudden nitrates spikes that began to occur in November, 2002, and have occurred every November thereafter. • Study says, “Historically, nitrate concentrations in November were in decline, rather than peaking.”
Issues for which responses are requestedIssue #4: Reference to Amick and Burgess study on sewer exfiltration RWQCB staff: Based on review of the Amick and Burgess study, “Exfiltration in Sewer Systems” , material from that study was correctly applied in City-funded study in support of the claim that exfiltrated sewage could not be a significant source of the nitrates in the wells. Our Concerns: • Material cited was incomplete and out of out of context. (ref. slide 8) • Amick and Burgess study was about, and clearly outlined the serious risks of sewage exfiltration • According to the Amick and Burgess study, exfiltration rates have been found, in many places, to be quite high. For example, as stated in the study, exfiltration rates as high as 56% of total flow were estimated in one test in Berkeley, California (ref. slide 8)
Issues for which responses are requestedIssue #5: “Pro-active” maintenance of the Morro Bay wastewater collections system RWQCB staff: The City of Morro Bay was proactive in operating and maintaining its collections system to correct sanitary sewer system deficiencies. Our Concerns: • Numerous and severe sewer line defects shown in video inspections and logs, with same defects appearing and worsening over a period of years • Collapse of Atascadero Road line which had known defects but was not repaired until it failed completely (reported in local newspaper) • According to a letter dated November 18, 1999, from David Phillips to Bob Hendrix, in regard to the detection of MTBE at the sewer plant, “The pipeline damage that was apparent in past video inspections is the likely point of introduction”
Issues for which responses are requestedIssue #6:Hydraulic connection between area of Shell Station site and municipal well field RWQCB staff: The area beneath the City’s wells is likely hydraulically disconnected from the former Shell station area due to geologic formations in the area Our Concerns: • As reported in February, 2001, settlement required Shell to: “Clean up the MTBE in the Morro Creek ground-water basin and making sure contamination does not reach the city's four drinking water wells, located some 500 feet west of the station. The state Health Agency ordered the city not to use the Morro Creek wells unless in an emergency to prevent drawing the contamination through the basin toward them.” • Movement of the MTBE plume was demonstrated to be associated with production at the City well field. • MTBE was found in the groundwater drawn by MW-26, a monitoring well cluster located a very short distance from the wells. (ref. slide 5) • In 2006, consultant recommended against remediation site closure due to risk of MTBE contamination of wells.
Issues for which responses are requestedIssue #6:Alleged decline in Morro Basin well field production RWQCB staff: Production from the Morro Basin well field has been declining from 2009 to the present Our Concerns: City of Morro Bay well production data demonstrates that Morro Basin well production has not been declining from 2009 to the present. Spike in early 2010 was due to State water cutback. Usage has been steady since then.
Issues for which responses are requestedIssue #8:Correlation between nitrate concentrations and creek flows RWQCB staff: RWQCB staff’s analysis of creek flow, well drawdown, well production, and nitrate concentrations indicates that there is a “yearly cycle and strong inverse correlation between nitrate concentrations and creek flows” Our Concerns: • It is an established fact that the creek flows are highest in Morro Bay during the rainy season. In fact, RWQCB staff stated, in writing, “The ephemeral creek begins to flow after significant rainfall events…” • Graph of well nitrate concentrations for well 03 and rainfall data shows a weak direct correlation; not an inverse one.
Issues for which responses are requestedIssue #9:Pattern of comparative nitrate levels in the Morro Basin wells RWQCB staff: Nitrate levels in the Morro Basin wells correspond to the distances between the individual wells and Morro Creek, which dilutes the water drawn by the wells. The closer a well is to the creek, the more the water is diluted. Our Concerns: • During summer and early fall, the creek is dry and thus cannot dilute anything. Yet, the pattern of relative nitrate levels in the wells remains constant • The two Morro Bay Mutual Water wells are farther from the sewer trunk lines than the City wells. They always have nitrate levels radically lower than those of the City wells. Example:May 2011. Note: Only one is MBMW well is closer to the creek than the municipal wells. • City well 3 – nitrate level 62 • City well 4 – nitrate level 45 • City well 14 – nitrate level 37 • City well 15 – nitrate level 20 • Morro Bay Mutual Water wells – two nitrate level readings: 2.2 and 2.6 • ALL of the water, surface and underground, is funneled through the aquifer “narrows” just before it reaches the area of the wells • RWQCB staff cited no specific data or scientific principles in support of the assumption that nitrates would be less concentrated in the surface stream water from the Morro Valley than the underground water from the same source.
Selected References Morro Basin well nitrate data, obtained from California Department of Public Health Morro Bay Mutual Water well nitrate Data, obtained from San Luis Obispo County Health Department Morro Bay water production reports, obtained from City of Morro Bay Morro Bay rainfall data, as recorded at Morro Bay Fire Station, obtained from weatherwarehouse.com City of Morro Bay 2005 Urban Water Management Plan “Morro Basin Nitrate Study”, written for the City of Morro Bay by Cleath and Associates, December, 2007 “Morro Basin Nitrate Study – Issues and Concerns” by Richard Sadowski and Marla Jo Bruton, April, 2008 “Condition of the Morro Bay Wastewater Collection System - Video Inspection Review and Analysis” by Richard Sadowski and Marla Jo Bruton, October, 2007 “Exfiltration in Sewer Systems”, Amickand Burgess, December, 2000 Letter from Ken Harris to Linda Stedjee, September 25, 2013 Email from Linda Stedjee to Ken Harris, September 26, 2013 Email from Linda Stedjee to Ken Harris, September 27, 2013 Letter from Harvey Packard to Richard Sadowsi and Marla Jo Bruton, subject, Morro Basin Nitrate Study, July 1, 2008 Letter from Richard Sadowski and Marla Jo Bruton to Harvey Packard , subject, Morro Basin Nitrate Study, July 7, 2008 Letter from Timothy Cleath to Frank Cunningham, subject, Review of case closure request, former Shell Service Station, 1840 Main Street. Morro Bay, California, May 1, 2006 Los Angeles Times, “Oil Firms Agree to Clean Up Morro Bay's Tainted Water”, March 11, 2001 San Luis Obispo Tribune , “MtBE Complicates Task as Towns Mull Aging Sewer”, May 24, 2000