Download
1 / 14
140 likes | 305 Vues
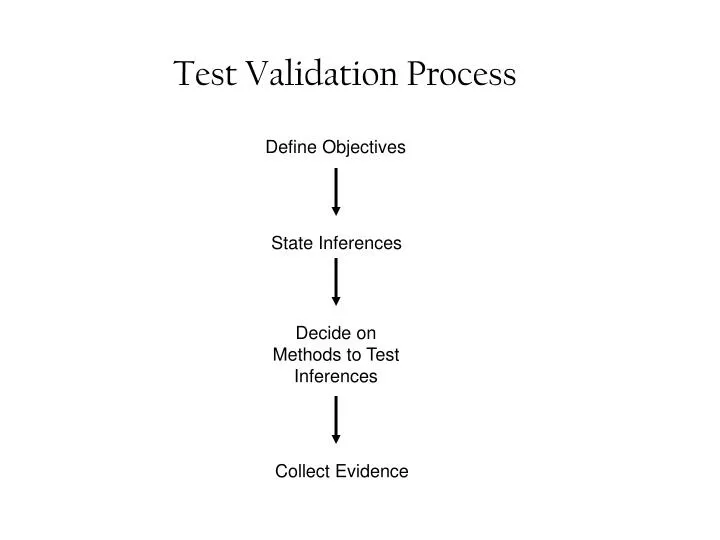
Test Validation Process. Define Objectives. State Inferences. Decide on Methods to Test Inferences. Collect Evidence. Types of Validity. Content Validity [ the extent to which test items represent the domain] a) Subject Matter Expert Opinions (e.g., CVR statistic)

E N D
Test Validation Process Define Objectives State Inferences Decide on Methods to Test Inferences Collect Evidence
Types of Validity • Content Validity [the extent to which test items represent the domain] • a)Subject Matter Expert Opinions (e.g., CVR statistic) • Internal consistency reliability • c) Correlation with other similar tests Test Item Domain ?? ? ? ? ? ? ? ? ? ? ? ?? ? ? ? ? ? ?
CVR Statistic (Content Validity Ratio; Lawshe) Ne – N ne # raters 10 – 0 10 = 1 Excellent item 8 – 2 10 = .60 Possible item for inclusion 5 – 5 10 = 0 Poor item 0 – 10 10 = -1.0 Very poor item
Steps in a Content Validation Effort • Perform a job analysis • Description of job tasks • Rating of job tasks on various criteria • Specification of KSAs • Rating of KSAs on various criteria • Link tasks to KSAs • Selection of SMEs • 3)Writing and evaluation of selection measure content (test items)
Types of Validity (cont.) Criterion-related Validity ~ Predictive ~ [Correlation between test scores of applicants and their performance scores after a certain amount of time has passed after being hired] Range restriction issue on performance scores Time, cost, & pragmatic concerns ~ Concurrent ~ [Correlation between test scores and performance scores of current employees] Motivation level Guessing, Faking Job experience factor Range restriction issue on performance scores
Criterion-related Validity Issues • Job Stability • Reliable and relevant measure of job performance • Use of a representative sample of people and jobs • Large sample (on predictor and criterion)
Albemarle Paper v. Moody • Why did the Court decide against Albemarle? • A)Using a test for jobs on which it had not been validated. • B) Using pair-comparisons for performance assessment with no basis for the judgments • C) Using a test for entry-level jobs that was validated only on upper-level positions. • D) Validating tests on a group that is not representative of job applicants.
Types of Validity (cont.) • Construct Validity [the extent to which a test assesses what it intends to measure] • Correlation between scores measuring a construct (e.g., anxiety) with one method (e.g., paper & pencil) with scores on the same construct using a different method (e.g., interview) [Convergent validity] • Correlation between scores measuring a construct (e.g., anxiety) using one method (e.g., paper & pencil) with scores on a different construct (e.g., leadership) assessed with a different method (e.g., interview) [Discriminant validity]
Proportion of “Successes” Expected Through the Use of Test of a Given Validity and Selection Ratio (Base Rate .60) (From Taylor & Russell, 1939, p. 576) Selection Ratio Validity .05 .10 .20 .30 .40 .50 .60 .70 .80 .90 .95 .00 .60 .60 .60 .60 .60 .60 .60 .60 .60 .60 .60 .05 .64 .63 .63 .62 .62 .62 .61 .61 .61 .60 .60 .10 .68 .67 .65 .64 .64 .63 .63 .62 .61 .61 .60 .15 .71 .70 .68 .67 .66 .65 .64 .63 .62 .61 .60 .20 .75 .73 .71 .69 .67 .66 .65 .64 .63 .62 .61 .25 .78 .76 .73 .71 .69 .68 .66 .65 .63 .62 .61 .30 .82 .79 .76 .73 .71 .69 .68 .66 .64 .62 .61 .35 .85 .82 .78 .75 .73 .71 .69 .67 .65 .63 .62 .40 .88 .85 .81 .78 .75 .73 .70 .68 .66 .63 .62 .45 .90 .87 .83 .80 .77 .74 .72 .69 .66 .64 .62 .50 .93 .90 .86 .82 .79 .76 .73 .70 .67 .64 .62 .55 .95 .92 .88 .84 .81 .78 .75 .71 .68 .64 .62 .60 .96 .94 .90 .87 .83 .80 .76 .73 .69 .65 .63 .65 .98 .96 .92 .89 .85 .82 .78 .74 .70 .65 .63 .70 .99 .97 .94 .91 .87 .84 .80 .75 .71 .66 .63 .75 .99 .99 .96 .93 .90 .86 .81 .77 .71 .66 .63 .80 1.00 .99 .98 .95 .92 .88 .83 .78 .72 .66 .63 .85 1.00 1.00 .99 .97 .95 .91 .86 .80 .73 .66 .63 .90 1.00 1.00 1.00 .99 .97 .94 .88 .82 .74 .67 .63 .95 1.00 1.00 1.00 1.00 .99 .97 .92 .84 .75 .67 .63 1.00 1.00 1.00 1.00 1.00 1.00 1.00 1.00 .86 .75 .67 .63 Note: A full set of tables can be found I Taylor and Russell (1939) and in McCormick and Ilgen (1980, Appendix B).
Selection Ratio Example Mean Standard Criterion Score of Accepted Cases in Relation to Test Validity and Selection Ratio (From Brown & Ghiselli, 1953, p. 342) Validity Coefficient Selection Ratio .00 .05 .10 .15 .20 .25 .30 .35 .40 .45 .50 .55 .60 .65 .70 .75 .80 .85 .90 .95 1.00 .05 .00 .10 .21 .31 .42 .52 .62 .73 .83 .94 1.04 1.14 1.25 1.35 1.46 1.56 1.66 1.77 1.87 1.98 2.08 .10 .00 .09 .18 .26 .35 .44 .53 .62 .70 .79 .88 .97 1.05 1.14 1.23 1.32 1.41 1.49 1.58 1.67 1.76 .15 .00 .08 .15 .23 .31 .39 .46 .54 .62 .70 .77 .85 .93 1.01 1.08 1.16 1.24 1.32 1.39 1.47 1.55 .20 .00 .07 .14 .21 .28 .35 .42 .49 .56 .63 .70 .77 .84 .91 .98 1.05 1.12 1.19 1.26 1.33 1.40 .25 .00 .06 .13 .19 .25 .32 .38 .44 .51 .57 .63 .70 .76 .82 .89 .95 1.01 1.08 1.14 1.20 1.27 .30 .00 .06 .12 .17 .23 .29 .35 .40 .46 .52 .58 .64 .69 .75 .81 .87 .92 .98 1.04 1.10 1.16 .35 .00 .05 .11 .16 .21 .26 .32 .37 .42 .48 .53 .58 .63 .69 .74 .79 .84 .90 .95 1.00 1.06 .40 .00 .05 .10 .15 .19 .24 .29 .34 .39 .44 .48 .53 .58 .63 .68 .73 .77 .82 .87 .92 .97 .45 .00 .04 .09 .13 .18 .22 .26 .31 .35 .40 .44 .48 .53 .57 .62 .66 .70 .75 .79 .84 .88 .50 .00 .04 .08 .12 .16 .20 .24 .28 .32 .36 .40 .44 .48 .52 .56 .60 .64 .68 .72 .76 .80 .50 .00 .04 .07 .11 .14 .18 .22 .25 .29 .32 .36 .40 .43 .47 .50 .54 .58 .61 .65 .68 .72 .60 .00 .03 .06 .10 .13 .16 .19 .23 .26 .29 .32 .35 .39 .42 .45 .48 .52 .55 .58 .61 .64 .65 .00 .03 .06 .09 .11 .14 .17 .20 .23 .26 .28 .31 .34 .37 .40 .43 .46 .48 .51 .54 .57 .70 .00 .02 .05 .07 .10 .12 .15 .17 .20 .22 .25 .27 .30 .32 .35 .37 .40 .42 .45 .47 .50 .75 .00 .02 .04 .06 .08 .11 .13 .15 .17 .19 .21 .23 .25 .27 .30 .32 .33 .36 .38 .40 .42 .80 .00 .02 .04 .05 .07 .09 .11 .12 .14 .16 .18 .19 .21 .22 .25 .26 .28 .30 .32 .33 .35 .85 .00 .01 .03 .04 .05 .07 .08 .10 .11 .12 .14 .15 .16 .18 .19 .20 .22 .23 .25 .26 .27 .90 .00 .01 .02 .03 .04 .05 .06 .07 .08 .09 .10 .11 .12 .13 .14 .15 .16 .17 .18 .19 .20 .95 .00 .01 .01 .02 .02 .03 .03 .04 .04 .05 .05 .06 .07 .07 .08 .08 .09 .09 .10 .10 .11
Example of Brogden and Cronbach & Gleser Models Ns rxy SDyZx – NT (C) cost of assessing each applicant number of applicants assessed validity coefficient # of applicants selected average score on the selection procedure of those selected (standard score) Standard deviation of job performance in dollars
Intercept Bias (Test) Satisfactory Minority Performance Criterion Non minority Unsatisfactory Reject Accept Predictor Score Equal validity, unequal predictor means. Job performance is equal Test scores are greater for non-minorities
Satisfactory Non minority Performance Criterion Minority Unsatisfactory Reject Accept Predictor Score Equal validity, unequal criterion means Equal test scores; Minorities performing less well on job (over predicting performance) Minorities hired same as non minorities but probability of success is small.Can reinforce existing stereotypes.
Satisfactory Minority Non minority Performance Criterion Unsatisfactory Accept Reject Predictor score Equal predictor means, but validity only for non minority groups. Equal test scores and criterion scores No validityfor minorities (only should be used for non minorities) No adverse impactsame numbers hired in each group However, more non-minorities will succeed on jobs; can reinfored stereotypes