Download
1 / 45
470 likes | 650 Vues
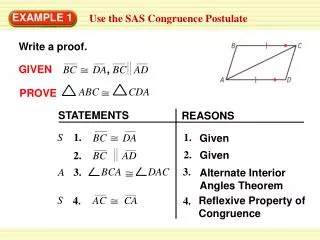
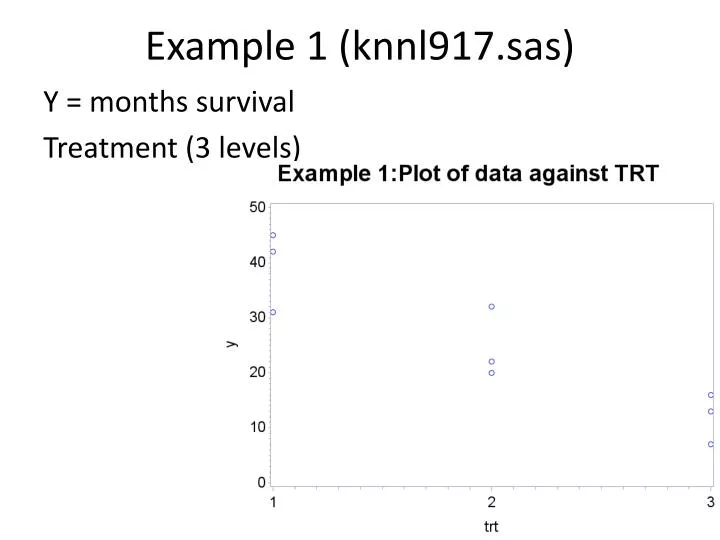
Example 1 (knnl917.sas). Y = months survival Treatment (3 levels). Example 1: ANOVA. Example 1: Including the covariate. Example 1: ANCOVA. Example 1: ANCOVA (cont). Example 1: ANCOVA comparison. Example 2. Y = months survival Treatment (3 levels). Example 2: ANOVA.

E N D
Example 1 (knnl917.sas) Y = months survival Treatment (3 levels)
Example 2 Y = months survival Treatment (3 levels)
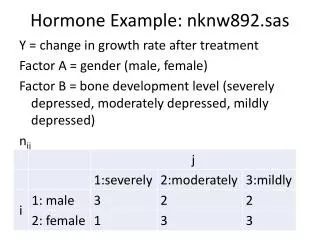
Crackers Example: nknw1020.sas Y = number of cases sold during promotion Factor: promotion type 1: sampling of crackers in the store 2: additional shelf space 3: shelf space at the end of the aisles n = 5 X = cases sold before the promotion
Crackers Example: Input data crackers; infile‘H:\My Documents\Stat 512\CH22TA01.DAT'; input cases last treat store; procprintdata=crackers;
Crackers Example: Interaction Plot 1 title1h=3'Interaction plot without lines'; axis2label=(angle=90); symbol1v='1'i=nonec=black h=1.5; symbol2v='2'i=nonec=red h=1.5; symbol3v='3'i=nonec=blue h=1.5; procgplotdata=crackers; plot cases*last=treat/vaxis=axis2; run;
Crackers Example: Interaction Plot 2 title1h=3'Interaction plot with lines'; symbol1v='1'i=rlc=black h=1.5; symbol2v='2'i=rlc=red h=1.5; symbol3v='3'i=rlc=blue h=1.5; procgplotdata=crackers; plot cases*last=treat/vaxis=axis2; run;
Crackers Example: ANOVA procglmdata=crackers; class treat; model cases=last treat/solutionclparm; run;
Crackers Example: LSMEANS procglmdata=crackers; class treat; model cases=last treat; lsmeans treat/stderrtdiffpdiffcl; run;
Crackers Example: LSMEANS (cont) Note: To ensure overall protection level, only probabilities associated with pre-planned comparisons should be used.
Crackers Example: Plot without covariate title1h=3'No covariate'; procglmdata=crackers; class treat; model cases=treat; outputout=nocov p=pred; run; symbol1v=circle i=nonec=blue; symbol2v=nonei=join c=blue; procgplotdata=nocov; plot (cases pred)*treat/overlayvaxis=axis2; run;
Crackers Example: Non-constant slope title1'Check for equal slopes'; procglmdata=crackers; class treat; model cases=last treat last*treat; run;
Crackers Example: Y’ datacrackerdiff; set crackers; casediff = cases - last; procglmdata=crackerdiff; class treat; modelcasediff = treat; means treat / tukey; run;
Cash Example: Problem 22.15, nknw1038.sas Y = offer made by a dealer on a used car (units $100) used car was ONE medium-priced, six-year old car Factor A = age of person selling the car (young, middle, elderly) Factor B = gender of person selling the car (male, female) n = 6 X = overall sales volume for the dealer
Cash Example: Input data cash; infile‘H:\My Documents\Stat 512\CH22PR15.DAT'; input offer age gender rep sales; procprint;run;
Cash Example: scatterplot (without covariate) datacashplot; set cash; if age=1 and gender=1then factor = '1_youngmale'; if age=2 and gender=1then factor = '2_midmale'; if age=3 and gender=1then factor = '3_eldmale'; if age=1 and gender=2then factor = '4_youngfemale'; if age=2 and gender=2then factor = '5_midfemale'; if age=3 and gender=2then factor = '6_eldfemale'; title1h=3'Plot of Offers against Factor Combinations w/o Covariate'; axis1label=(h=2); axis2label=(h=2angle=90); procgplotdata=cashplot; plot offer*factor/haxis=axis1 vaxis=axis2; run;
Cash Example: ANOVA (without covariate) procglmdata=cash; class age gender; model offer = age|gender; means age gender /tukey; run;
Cash Example: scatterplot (with covariate) symbol1v=A h=1.5c=black; symbol2v=B h=1.5c=red; symbol3v=Ch=1.5c=blue; symbol4v=D h=1.5c=green; symbol5v=E h=1.5c=purple; symbol6v=F h=1.5c=orange; title'Plot of Offers vs Sales by Factor'; procgplotdata=cashplot; plot offer*sales=factor/haxis=axis1 vaxis=axis2; run;
Cash Example: ANCOVA (with covariate) procglmdata=cash; class age gender; model offer=sales age|gender; lsmeans age gender /tdiffpdiffcladjust=tukey; run;