Download
1 / 26
260 likes | 450 Vues
Creating Dashboard with Excel. ISYS 650. Pivot Table Demo. Creating a query from Northwind data warehouse that shows: OrderYear, Quarter, CategoryID, Sales Then download to Excel and create a pivot table and pivot chart to analyze sales based on OrderYear, Quarter and CategoryID.

E N D
Creating Dashboard with Excel ISYS 650
Pivot Table Demo • Creating a query from Northwind data warehouse that shows: • OrderYear, Quarter, CategoryID, Sales • Then download to Excel and create a pivot table and pivot chart to analyze sales based on OrderYear, Quarter and CategoryID.
Pivot Chart Demo • Click the pivot table to show the PivotTable tools, and then click Pivot Chart. • Demo: • Drill down/RollUp • Reaggregation • Row lables’ filter
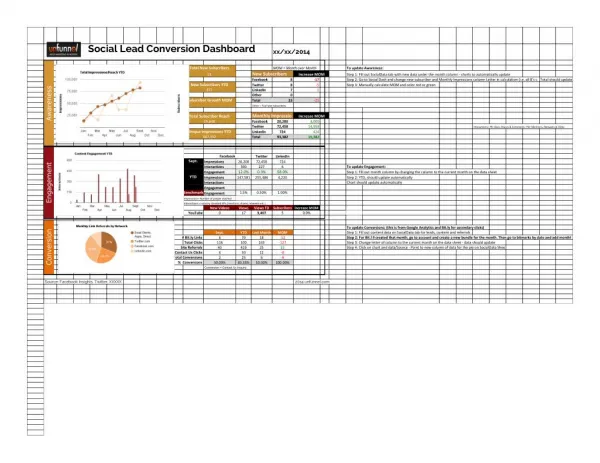
Monitor Business Performance:products’ yearly sales • The management has an annual sales plan: • A projected sales for each product category • A total annual sales projection • Compare actual sales with planned sales.
From Data warehouse to analytic tool Data Warehouse Local Management Database Analytic Tools
Query the data warehouse to get actual sales by year and category
Download actual sales data to the management DB and create query to compare actual sales and projected sales
GetPivotData FunctionTo extract data from an Excel Pivot Table • To enable this function: • Place the pointer inside the pivot table • Click the PivotTable tools button • Click Pivot table option • Select Generate GetPivotData • To generate a GetPivotData function automatically • 1. Enter a “=“ in a cell • 2. Select the pivot table data you want to extract
Note 1: Allow uer to enter category and year. Note 2: Modify the generated GetPivotData function to reference the cells with entered category and year: =GETPIVOTDATA("Sum of ActualSales",$A$3,"OrderYear",B20,"CategoryID",B19)
Choose Controls • Command button, listbox, textbox, check box, option button, etc. • Developer/Design Mode/Insert • Select and drag controls to worksheet • Right click control to: • Use control’s property window to set property values. • Use View Code to add VBA code.
Spin Button • Properties: • Max: 500000 • Min: 100000 • SmallChange: 10000 • Value • LinkedCell: C9
Option Button • For Option Button to work, a worksheet must have more than one Option Buttons that forms a group. • Use the Properties window to enter the LinkedCell and use it to display True/False for the option button. • Assuming D1 is the LinkedCell for 15-year term option: =IF(D1=TRUE,15,30)
ListBox • Properties: • ListFillRange: Source of listbox’s items • A2:C5 • ColumnCount: Number of columns in ListFillRange • 3 • Linked Cell • C11 • BoundColumn: The column that contains the return value. • 2 for 15-year and 3 for 30-year rates • Need VBA code: Private Sub OptionButton1_Change() If OptionButton2 Then ListBox1.BoundColumn = 3 Else ListBox1.BoundColumn = 2 End If End Sub
Check Box • CheckBox can work individually. • Property: • Linked Cell
Exact Match VLookUp Function . What if P4 is entered in B1? . To do an Exact Match look up: VLookUp(SearchValue, TableRange, TableColumn#, False)
Other Look up Functions • Match: Returns the relative position of an item in an range that matches a specified value in a specified order. • Use MATCH instead of one of the LOOKUP functions when you need the position of an item in a range instead of the item itself. • Index: Returns the reference of the cell at the intersection of a particular row and column.
Example • Sales by products and years:
Recording/Editing Macro • Recording macro: • Developer/Code/Record macro • Stop recording: • Developer/Code/Stop recording • View the macro: • Developer/Code/Macros
Learning VBA with Macro • Spreadsheet operations: • Copy/Paste/Fill/Clear/Delete • Format cells • Adding a worksheet • Insert/Delete rows, cols • Window scroll • Command Bar commands