Download
1 / 36
360 likes | 365 Vues
The Community Microgrid Initiative promotes the development of local grids powered by renewable energy sources, enabling resilience and sustainability. This initiative aims to rebuild fire-damaged areas and create a blueprint for cost-effective and sustainable energy systems.

E N D
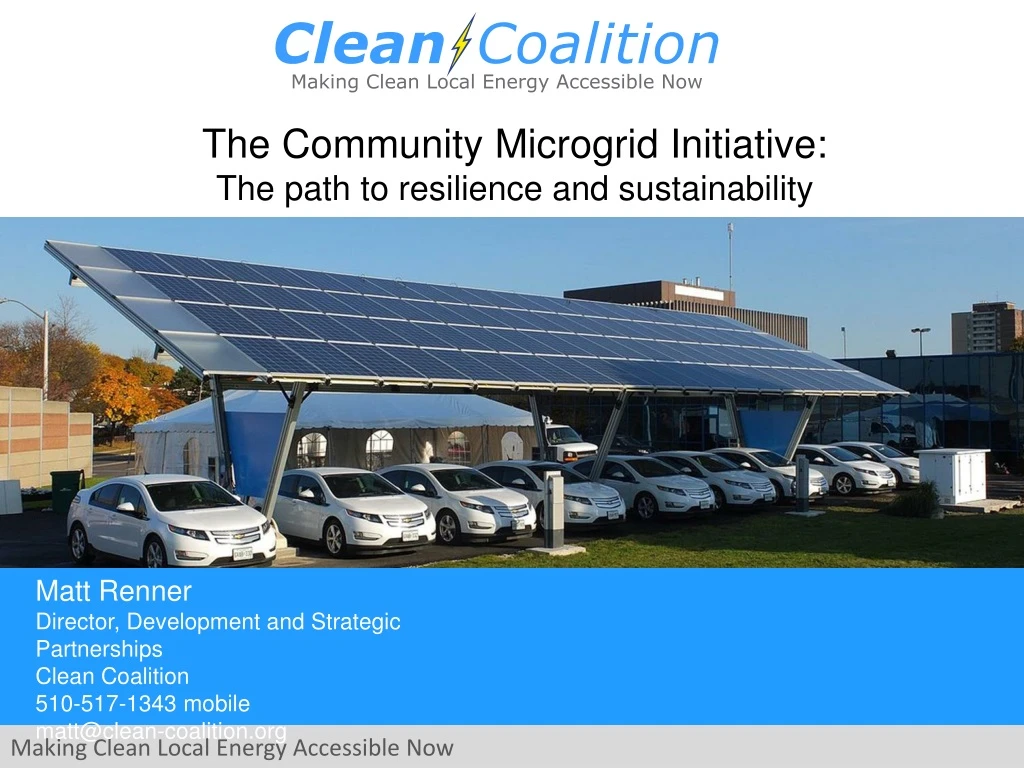
The Community Microgrid Initiative: The path to resilience and sustainability Matt Renner Director, Development and Strategic Partnerships Clean Coalition 510-517-1343 mobile matt@clean-coalition.org
Clean Coalition (nonprofit) mission To accelerate the transition to renewable energy and a modern grid through technical, policy, and project development expertise
Expertise areas Community Microgrid Projects Program and Policy Design Grid Modeling & Optimization Analysis & Planning • Grid planning, procurement, and interconnection • LADWP, Fort Collins, PSEG • City of Palo Alto (FIT and solar canopy RFP) • RAM, ReMAT • Rule 21 & FERC • Design and implementation • San Francisco, CA • Long Island, NY • Montecito, CA • U.S. Virgin Islands • Full cost and value accounting for DER; siting analysis • PG&E • PSEG • SCE • Powerflow modeling; DER optimization • PG&E • PSEG • SCE
Traditional microgrids focus on single customers Source: Oncor Electric Delivery Company
Community Microgrids serve up to thousands of customers Source: Oncor Electric Delivery Company
Community Microgrid defined A modern approach for designing and operating the electric grid, stacked with local renewables and staged for resilience. • “Islanding” from the grid: A coordinated local grid area that can separate from the main grid and operate independently. • Components: Solar PV, energy storage, demand response, and monitoring, communications, & control • Clean local energy: Community Microgrids facilitate optimal deployment of distributed energy resources (DER). • Resilient: Ongoing, renewables-driven backup power for critical and prioritized loads. • Replicable: A solution that can be readily extended • and replicated throughout any utility service territory.
Community Microgrid enabling policies lead to rapid proliferation of distributed energy resources • Policies and programs to support development: • Feed-in Tariff 2.0 • Provides some certainty for developers and financiers, lowering costs • Features market-responsive pricing • Includes dispatchability and preferred location adders • Can support resilience and environmental justice/equity goals • Streamlined interconnection of in-front-of-the-meter distributed energy resources • Transmission Access Charges • Charges for transmission should no longer apply to distribution-connected generation, leading to lower transmission costs for load serving entities that choose clean local energy • Currently a massive market distortion in California and elsewhere • Distribution System Operator (DSO) • Local balancing, local markets • Provides grid services with aggregated DER portfolio • Manages “ducklings” at local level instead of one giant “duck curve”
Opportunity: Untapped commercial and industrial (C&I) parking and rooftops • Largest rooftops and parking lots — most generation potential • Largest daytime loads — matching peak solar production hours • Largest utility bills, including demand charges — motivated customers • Best solution for grid — system peak reduction, strong feeders already in place • Most carbon emissions within cities Solar on 25% of commercial and industrial rooftops = 25%+ annual energy use
North Bay Community Resilience Initiative Objective: make energy abundant, affordable, resilient, and sustainable Rebuild fire-destroyed areas with high levels of sustainability in homes, buildings, and the electric grid, enabling a modern, distributed, and low-carbon system that delivers substantial economic, environmental, and resilience benefits. Establish a blueprint for rebuilding disaster-destroyed areas in a timely and cost-effective manner that also maximizes the economic and resilience value of energy as a critical resource to ratepayers, property owners, and municipalities. Provide a model for operating a modern distribution grid that incorporates optimal distributed energy resources, full interaction with the transmission system, and local energy markets — with resulting benefits across both grid operations and economics. Ensure that building codes are advanced to achieve more resilient, safer, and cleaner building stock and communities. Lower ratepayer costs: DER will be utilized to defer or avoid substantial costs including peak energy procurement and transmission & distribution (T&D) infrastructure investments.
North Bay Community Resilience Initiative Team • Clean Coalition • Sonoma Clean Power • PG&E • Rebuild North Bay • Center for Climate Protection • County of Sonoma, Energy & Sustainability Division • Regional Climate Protection Authority • Bay Area Air Quality Management District • Design AVEnues, LLC — EE/ZNE expert Ann Edminster • Stone Edge Farm Microgrid Stone Edge Farm Microgrid
North Bay Community Resilience Initiative: **Example location only** Fire-damaged area • Larkfield and the Old Redwood Highway Corridor – ideal for Community Microgrid • Served by single substation, Fulton.
North Bay Community Resilience Initiative Example key sites: critical, priority, large roofs & parking, etc. Larkfield and the Old Redwood Highway Corridor • Sutter Santa Rosa Regional Hospital • Luther Burbank Center for the Arts • Cardinal Newman High School • Mark West School and area • Larkfield Shopping Center • Molsberry Markets • John B Riebli School • St. Rose School
Example: Larkfield and Old Redwood Highway AreaCommunity Resilience block diagram Larkfield Shopping Center FULTON 1107 North of Mark West Springs Rd Fulton Substation Transmission South of Mark West Springs Rd Sutter Santa Rosa Hospital Medical Offices Luther Burbank Ctr for Arts Cardinal Newman High School Diagram Elements Autonomously Controllable Microgrid Relay/Switch (open, closed) Tier 2 & 3 Loads Tier 2 & 3 Loads Tier 2 & 3 Loads Tier 2 & 3 Loads
North Bay Community Resilience Initiative:Homes and buildings as grid partners • Well-designed and well-situated ZNE homes become a valuable part of the resource mix when combined with larger PV arrays on commercial and industrial structures.
Advanced Energy Rebuild for Homes Support for Rebuild • Sonoma Clean Power (SCP), Pacific Gas and Electric Company (PG&E), and Bay Area Air Quality Management District have joined efforts to help homeowners affected by the firestorms to rebuild energy-efficient, sustainable homes. • The program is an enhancement to PG&E’s long-standing California Advanced Homes Program, and offers two incentive packages tailored to Sonoma and Mendocino Counties. • Each package has a flexible performance pathway or a simple prescriptive menu.
North Bay Community Resilience Initiative: Resilience, economic, and environmental benefits Example target: 30 MW Solar PV Benefits over 20 years • Environmental • 46M pounds:Annual reductions in GHGemissions • 10M gallons: Annual water savings • 225: Acres of land preserved • Economic • $120M: New regional impact • $60M:Added local wages • 1,000 job-years:New near-term and ongoing employment • $6M:Site leasing income Resilience $50M:Avoided transmission costs $20M:Avoided power interruptions • Example: Largerooftop • System size = 714 kW • Example: Largeparking lot • System size = 567 kW • Example: 50 avg. rooftops • Avg. system size = 5 kW Residential: 10 MW Commercial: 18 MW Parking lots: 2 MW
Value of Resilience How much does resilience cost and what is its value?
What does lack of resilience cost? • $119 billion:Annual cost of power outages to the U.S. • $20 - $55 billion:Annual cost to Americans of extreme weather and related power outages • $243 billion - $1 trillion: Potential cost of a cyber attack that shuts down New York and D.C. areas
Resilience provided by Community Microgrids has tremendous value during a disaster • Powers critical loads until utility services are restored • Eliminates need to relocate vulnerable populations (infirm, elderly, and disadvantaged) • Ensures continued critical services • Water supply, medical and elder-care facilities, grocery stores, gas stations, shelters, communications centers • Avoids the cost of emergency aid logistics • Provides power for essential recovery operations • Lighting for buildings, communications, water pumps for firefighting and flood control, emergency shelters, food refrigeration • Reduces dependence on diesel generators • Diesel can be expensive and difficult to deliver in emergencies • Ongoing diesel maintenance requires regular operation with onsite air pollution • Keeps businesses open • Serves the community and maintains revenue streams
But how do we determine the monetary value of resilience? Factors to consider • Cost of outages: Varies by location, population density, facility type. Can include lost output and wages, spoiled inventory, delayed production, damage to the electric grid • Cost of storage: Varies by size of electric load and size of critical load • Cost of islanding: 3% - 21% of non-islandable solar+storage cost (figures from NREL)
Value of Resilience: $2,808/kW of critical load per year Annually, resilience is worth $2,808per kilowatt of critical load in the US • Based on real-world scenarios run through the Clean Coalition VOR model • Tier 1 = Critical load, usually 10% of total load — life-sustaining or crucial to keep facility operational during a grid outage • Tier 2 = Priority load (15%) — important but not necessary to keep operational during an outage • Tier 3 = Discretionary load (75%) — the remainder of the total load • Based on keeping critical load online for one day on the worst-case solar day • If outage spans days with greater solar resource, may be able to keep Tier 2 or even Tier 3 loads online
Valuing resilience: The Clean Coalition Value of Resilience (VOR) Model The size of your load: How much electricity do you use per year? The size of your critical load: What percentage of your electrical load is essential to keep running during an extended outage? For many facilities, this is 10%. The length of outage you want to prepare for: Do you want to prepare for short outages of a few minutes, or prepare for outages lasting several days or more? The cost of an outage: How much revenue or productivity do you lose per hour during an outage? If you don’t have this figure, you can use the national average of $117 per kilowatt-hour, based on data from the Department of Energy’s National Renewable Energy Lab (NREL). Your energy storage system: The minimum and maximum state of charge you’d like to allow for your battery; the initial state of charge at the time of an outage; and your battery cost (including cost/benefit analysis for demand charge reduction), capacity, and round-trip efficiency. The amount of sunshine in your area: Average amount of sunshine in your area, as well as the amount of sunshine on the worst 5 solar days of the year.
Clean Coalition Value of Resilience Model outputs The tool calculates: • The minimum battery capacity you need for resilience • The total cost for a system at your site to monetize demand charge reduction • Your total system cost, based on the required battery capacity • Resilience cost: The total system cost for the resilience portion of your system • Resilience value: The annual value of resilience provided by your system
Value of resilience for a Community Microgrid:One building at a corporate campus Cost of resilience Value of resilience • Cost of resilience = -$33,226 per kW of critical load • Annual value of resilience = $2,808 per kW of critical load • Break-even point = immediate
Value of resilience for a Community Microgrid:Medium-sized installation at large corporate campus Cost of resilience Value of resilience • Cost of resilience = $7,040 per kW of critical load • Annual value of resilience = $2,808 per kW of critical load • Break-even point = 2.5 years
Value of resilience for a Community Microgrid:Campus-wide installation at large corporate campus Cost of resilience Value of resilience • Cost of resilience = $7,829 per kW of critical load • Annual value of resilience = $2,808 per kW of critical load • Break-even point = 2.8 years
The future of energy is distributed… • California’s distributed solar and efficiency saves $2.6 billion on power lines • In March 2018, California’s grid operator signed off on the state’s 2017-2018 Transmission Plan, which approved 17 new transmission projects combined at a cost of nearly $271 million. • 20 transmission projects were canceled and 21 were revised due to energy efficiency and residential solar power altering local area load forecasts. • The projected savings from these changes is estimated to be $2.6 billion.
The future of energy is distributed… • Sacramento Utility Pushes All-Electric Homes: “California Is Wasting Money to Build Homes With Gas” • On June 1, the Sacramento Municipal Utility District (SMUD) launched an incentive program to provide rebates promoting electrification in both retrofitted and new homes. • SMUD’s electrification rebate packages are worth up to $5,000 for new homes and up to $13,750 for gas-to-electric conversions in existing homes. • 10% of California’s GHG emissions come from burning fossil fuels for space and water heating in buildings. SMUD’s electrification initiative helps achieve its 2050 GHG reduction target.
The future of energy is distributed… • Canada plan promises to transform cities and communities • “Build Smart ─ Canada’s Buildings Strategy” plan commits Ottawa to develop — and the provinces and territories to adopt — a series of model building codes requiring increasingly higher levels of energy efficiency. • Under the plan, by 2030, every new building being built in the country will be required to meet a net-zero-energy-ready level of performance. • In other words, in just over a dozen years or so, new buildings will be so well-designed and carefully built that they should be able to meet all of their energy needs with renewable energy either generated on-site or nearby.
The future of energy is distributed… Vermont utility Green Mountain Power now pays customers over $30 per month to use their battery systems as a load-offsetting resource. • Helps address the steeptransmission access chargeassessed by ISO New England. That charge more than doubled from $3 per kilowatt per month in 2016 to over $7 in 2017, and is expected to increase to over $9 in 2018. • As more solar is installed on the distribution grid, access to locally generated and stored solar energy at times when electricity from transmission is the most expensive is a grid benefit that can save money for utilities and customers.
The future of energy is distributed… Illinois is now "transforming the regulatory compact" to embrace performance-based policy goals • Illinois team at RMI eLab Accelerator, featuring utility ComEd, are devising four broad policy goals for future legislation and compensation: • Power sector decarbonization • 100% renewables • Community development and equity • Beneficial electrification of other sectors, e.g EVs • Illinois now supports shared utility + customer microgrids. Joe Svachula, VP Engineering & Smart Grid Technology at ComEd: “It’s an important step forward in our effort to develop a more secure, resilient, and reliable distribution system in the future.”
The advantages of distribute energy resources Sources: Newport Consulting Group, ICF Consulting
Restoration times for gas vs. electric service after a major urban earthquake (Data source: San Francisco Lifeline Council Interdependency Study, 2014)
$1B+ weather events in U.S. Jan – Sept 2017 Source: National Oceanic and Atmospheric Administration