Download

1 / 54
570 likes | 744 Vues
Scientific writing (81-933) Lecture 4 : Figures and Tables. Dr. Avraham Samson Faculty of Medicine in the Galilee. Tables and Figures. Editors (and readers) look first (and maybe only) at titles, abstracts, and Tables and Figures!

E N D
Scientific writing (81-933)Lecture 4: Figures and Tables Dr. Avraham Samson Faculty of Medicine in the Galilee
Tables and Figures Editors (and readers) look first (and maybe only) at titles, abstracts, and Tables and Figures! Like the abstract, figures and tables should stand alone and tell a complete story.
Table Titles and Footnotes • Titles: • Identify the specific topic or point of the table • Use the same key terms in the title, the column headings, and the text of the paper • Keep it brief
Table Titles and Footnotes • Footnotes: • Use superscript symbols to identify footnotes, according to journal guidelines: • A standard series is: *, †,‡,¶,#,**,††, etc. • Use footnotes to explain statistically significant differences • E.g., *p < 0.01 vs. control by ANOVA • Use footnotes to explain experimental details or abbreviations • E.g., EDI is the Eating Disorder Inventory (reference) • Amenorrhea was defined as 0-3 periods per year
Table Formats • Format: • Model your tables from already published tables! Don’t re-invent the wheel!! • Use (at least) three horizontal lines: one above the column headings, one below the column heading, and one below the data • Use a short horizontal line to group subheadings under a heading • Follow journal guidelines RE: • roman or arabic numbers; • centered or flush left table number, title, column, headings, and data; • capital letters and italics; • the placement of footnotes; • the type of footnote symbols
Three horizontal lines Tables: baseline, descriptive data Table 1. Base-Line Characteristics of the Women Who Underwent Radical Mastectomy and Those Who Underwent Breast-Conserving Therapy. Veronesi et al. Twenty-Year Follow-up of a Randomized Study Comparing Breast-Conserving Surgery with Radical Mastectomy for Early Breast Cancer NEJM 347:1227-1232; October 17, 2002
Tables: baseline, descriptive data n % Women’s health Initiative, JAMA, 2002
TABLE 1. Clinical and biochemical characteristics of control subjects and patients with anorexia nervosa From: Stoving: J Clin Endocrinol Metab, Volume 84(6).June 1999.2056-2063
Tables: To illustrate a point… From: nurses health study
Tables: to illustrate a point NEJM: Shain et al. 340 (2): 93, January 14, 1999
Figures Use few figures ($$$) and tables to tell the story Do not present the same data in both a figure and a table
Figures • Three varieties of Figures: • Primary evidence • electron micrographs, gels, photographs, spectra, etc. • indicates data quality • Graphs • line graphs, bar graphs, scatter plots, histograms, boxplots, etc. • Drawings and diagrams • illustrate experimental set-up • indicate flow of experiments or participants • indicate relationships or cause and effect or a cycle • give a hypothetical model
Figure Legends Allows the figure to stand alone. Contains: 1. Brief title 2. Experimental details 3. Definitions of symbols or line/bar patterns 4. Short explanation or Statistical information
Elliott E, Laufer O, Ginzburg I (2009) BAG-1M is upregulated in Alzheimer's Disease patients and associates with APP and tau proteins. Journal of Neurochemistry 109(4):1168-1178
Figure 1. Histologic Patterns in the Evolution from Chronic Gastritis to Gastric Lymphoma. NEJM Zucca et al. 338 (12): 804, Figure 1 March 19, 1998
Figures • Graphs • line graphs • scatter plots • bar graphs • individual-value bar graphs • histograms • box plots • relative risks • survival curves
Graphs • Exercise: • Which graphs work and why? • Which graphs confuse and why? • **Does the graph tell a simple story?
Figures • Graphs • line graphs • *Used to show trends over time or age • (can display group means or individuals)
Figure 3. Hypertension Prevalences in 6 European and 2 North American Countries, Men and Women Combined, by Age Group JAMA Vol. 289 No. 18, May 14, 2003
Figure 3. Effect of Weight Loss on Serum Leptin Concentrations and Expression of the ob Gene in Seven Obese Subjects, Expressed as a Percentage of the Initial Value. Considine et al. NEJM 334: 292; February 1, 1996
From: Oral topiramate for treatment of alcohol dependence: a randomised controlled trial Johnson et al. The Lancet.Volume 361;17 May 2003
Tables and Figures Figure 2: Change in self-reported drinking outcomes from baseline (week 0) by study week
Figures • Graphs • bar graphs • *Used to compare groups at one time point • *Tells a quick visual story
FIGURE 2- Relationship between BMC of the forearm/heel and time since menarche. *Significantly different than forearm BMC of group 1 (< 1 yr since menarche); BMCA: forearm BMC; BMCH: heel BMC. Medicine & Science in Sports & Exercise 2003; 35(5):720-729
Figures: bar graphs Figure 1. Bone mineral density of amenorrheic (gray bars) and eumenorrheic athletes (black bars). Asterisk indicates P<.01; error bars indicate SE. From: Rencken: JAMA, Volume 276(3).July 17, 1996.238-240
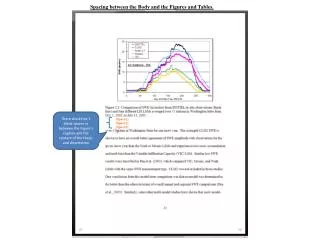
Comparison of the total loads accumulated in Tour and Vuelta. Phases I, II, and III are intensity phases below the ventilatory threshold (VT), between VT and the respiratory compensation point (RCP), and above RCP, respectively…. Medicine & Science in Sports & Exercise 2003; 35(5):872-878
Figures • Graphs • scatter plots • *Used to show relationships between two variables (particularly linear correlation) • *Allows reader to see individual data points=more information!
Figure 1. The Relation between the Percentage of Body Fat and the Serum Leptin Concentration in 136 Normal-Weight and 139 Obese Subjects. Considine et al. Serum Immunoreactive-Leptin Concentrations in Normal-Weight and Obese Humans NEJM 334: 292; February 1, 1996
Figure 2. Correlation between Expression of the ob Gene in Adipocytes and the Percentage of Body Fat in 27 Normal-Weight and 27 Obese Subjects. The data are expressed as the ratio of ob cDNA to actin cDNA. There was no difference in the amount of actin cDNA among the subjects studied. Considine et al. NEJM 334: 292; February 1, 1996
Fig. 4. Individual subject ApEn scores of GH secretion (m = 1; r = 20% sd) and cortisol secretion (m = 1; r = 80% sd) in normal weight women ([white four pointed star]) and in women with AN ([white diamond suit]). Horizontal lines represent the median values. *, P 0.05 (AN vs. controls). From: Stoving: J Clin Endocrinol Metab, Volume 84(6).June 1999.2056-2063
Figures • Graphs • Boxplots and histograms • To show or compare data distributions
maximum (163.9) minimum (93.9) median (127.0) whisker 75th percentile (138.6) interquartile range 25th percentile (115.5) Box Plot x Aquartile = a quarter of the data
Percent of total that fall in the 10-pound interval. Data are divided into 10-pound groups (called “bins”). With only one woman <100 lbs, this bin represents <1% of the total 120-women sampled. Histogram 125-135 115-125 135-145 105-115 155-165 95-105 145-155 85-95
Figures • Graphs • Confidence intervals/relative risks • To show dose-response of a protective or harmful factor
Diagrams and Drawings Figure 2. Relation between altitude and inspired oxygen pressure From: Peacock: BMJ, Volume 317(7165).October 17, 1998.1063-1066
Diagrams and Drawings Figure 5. Effect of hypoxia on central nervous system From: Peacock: BMJ, Volume 317(7165).October 17, 1998.1063-1066
Xiaojiang Gao Figure 3. Model of the Difference in the Rate of Progression to AIDS between Patients with HLA-B*35-Px and Those with HLA-B*35-PY. Gao et al. Effect of a Single Amino Acid Change in MHC Class I Molecules on the Rate of Progression to AIDSNEJM 344:1668-1675; May 31, 2001
Figure 6. Possible origin of partially committed keratinocyte stem cells, and their specific association. We have demonstrated that the three concentric regions of the hair follicle (ORS, IRS, and shaft) originate from distinct progenitor cells. As discussed in the text, three possibilities can be envisaged for the origin of these cells: (A) they may derive from a totipotent keratinocyte stem cell that is still present and operative in the mature hair follicle; (B) they may derive from a totipotent progenitor cell during development, but exist as independent entities in the mature hair follicle; (C) they may be intrinsically the same, but become committed to differentiate along different pathways in response to stimuli from the local environment. For three progenitor cells to come together and originate a hair follicle, they must either interact specifically with each other (D), or use a specific anchoring mechanism, which could be provided by dermal papilla cells and/or their extracellular matrix (E). This latter mechanism could contribute to the hair-inducing capability of dermal papilla cells (DP), together with the likely, but as yet elusive release of hair-inducing growth factors (GF). From: Kamimura: J Invest Dermatol, Volume 109(4).October 1997.534-540
ALLUDE v. ELUDE allude: to reference indirectly • She frequently alluded to her distrust of lawyers without explicitly stating her opinion. • He impressed the crowd with his allusions to Greek mythology. (n.b.: versus “illusion”) elude: to evade • The stealthy cat-burglar eluded the police all winter. • The elusive protein, which our team has been trying to characterize for months, has baffled labs across the country.
ARRANT v. ERRANT arrant: being notoriously without moderation; extreme • We are arrant knaves, all; believe none of us. (Shakespeare) errant: given to travelling; straying outside the proper path or bounds; moving aimlessly or irregularly; deviating from a standard; fallible • The errant toddler found his way into all sorts of mischief.