Download
1 / 40
400 likes | 464 Vues
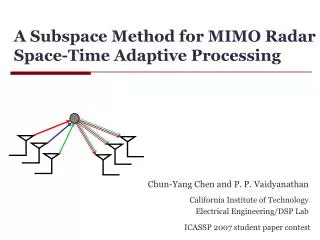
4D Sensors: Unifying the Space and Time Domain with Ultra-Fast Silicon Detectors.

E N D
4D Sensors: Unifying the Space and Time Domain with Ultra-Fast Silicon Detectors Hartmut Sadrozinski, Scott Ely, VitaliyFadeyev, Zachary Galloway, Jeffrey Ngo, Colin Parker, Brett Petersen, Abe SeidenSCIPP, Univ. of California Santa CruzNicoloCartiglia, AmadeoStaianoINFN TorinoMara Bruzzi, Riccardo Mori, Monica Scaringella, Anna VinattieriUniversitade Firenze
“4D” • Ultra-Fast Silicon Detectors (UFSD) incorporate the time-domain into the excellent position resolution of semiconductor sensors • they provide in the same detector and readout chain • ultra-fast timing resolution [10’s of ps] • precision location information [10’s of mm] A crucial element for UFSD is the charge multiplication in silicon sensors investigated by RD50, which permits the use of very thin detectors without loss of signal-to-noise. • 2 questions need to be addressed for UFSD: • can they work: signal, capacitance, collection time vs. thickness • will they work: required gain and E-field, fast readout • We hope that we will answer the questions within an RD50 Common Project (GiulioPellegrini)
Motivation for UFSD • Up to now, semiconductor sensors have supplied precision data only for the 3 space dimensions (diodes, strips, pixels, even “3D”), while the time dimension has had limited accuracy (e.g. to match the beam structure in the accelerator). • We believe that being able to resolve the time dimension with ps accuracy would open up completely new applications not limited to HEP • Proposal: Combined-function pixel detector will collect electrons from thin n-on-p pixel sensors read out with short shaping time electronics • Charge multiplication with moderate gain g ~10 increases the collected signal • Need very fast pixel readout
Time of Flight for Particle Identification in Space. The Alpha Magnetic Spectrometer (AMS) detector, operating in the International Space Station since 2011, performs precision measurements of cosmic ray composition and flux. The momentum of the particles is measured with high-resolution silicon sensors inside a magnetic field of about 1 m length. Atime resolution of 10 picoseconds, the “Holy Grail” of Cosmic Ray Physics: the distinction between anti-carbon ions and anti-protons can be achieved up to a momentum of 200 GeV/c.
Future: 4-D Ultra-Fast Si Detectors ? Protons of 200 MeV have a range of ~ 30 cm in plastic scintillator. The straggling limits the WEPL resolution. Replace calorimeter/range counter by TOF: Light-weight, combine tracking with WEPL determination Range straggling limit for 200 MeV p Hartmut F.-W. Sadrozinski: UFSD, Tredi 2013
Positron Emission Tomography PET Study accumulation of radioactive tracers in specific organs. The tracer has radioactive positron decay, and the positron annihilates within a short Distance with emission of 511 keVγ pair, which are observed in coincidence. Perfect Picture: Resolution and S/N Effects: Resolution of detector (pitch) Positron range A-collinearity Parallax (depth) T: true event S: Compton Scatter R: Random Coincidence A. Del Guerra, RESMDD12 Hartmut F.-W. Sadrozinski, UFSD, Tredi 2013
Reduce Accidentals & Improve Image: TOF-PET PET t1 t2 TOF-PET Localization uncertainty: Dd= c x Dt /2 When Dt = 200 ps ➔Dd = 3 cm @ VCI K. Yamamoto 2012 IEEE NSS-MIC Hartmut F.-W. Sadrozinski: UFSD, Tredi 2013
TOF – PET SNR Improvement • The improved source localization due to timing • leads to an improvement in signal-to-noise • and an increase in Noise Equivalent Count NEC For a given acquisition time and dose to the patient, TOF can provide better image quality and improved lesion detection. OR with TOF the scan time and dose can be reduced while keeping the same image quality ( better clinical workflow and added comfort for the patient). M. Conti, Eur. J. Nucl. Med. MoI Imaging (2011) 38:1147-1157 Hartmut F.-W. Sadrozinski: UFSD, Tredi 2013
Realistic gain & cap Good time resolution Per 1 cm UFSD Pixel / Strips Collected Charge Signal = thickness*EPM (EPM = 73 e-/mm Collection time = thickness/vsat (vsat = 80 mm/ns) For thickness > 5 um, Capacitance to the backplane Cb << Cint For thickness = 2 um, Cb ~ ½ of Cint, and we might need bipolar (SiGe)?
Impact Ionization A. Macchiolo,16th RD50 Workshop Barcelona, Spain, May 2010 Charge multiplication in path length ℓ : At the breakdown field in Si of 270kV/cm: ae≈ 1 pair/um ah ≈ 0.1 pair/um → In the linear mode (gain <10), consider electrons only Raise maximum and minimum E-field as close to breakdown field as possible
Non-uniform E-Field across a pixel/strip Example of electric field: Ф = 1.6·1015 n/cm2, U = 900 V Non-uniform Field across the implant results in charge collection difference Gregor Kramberger, 19th RD50 Workshop, CERN, Nov 2011 A. Macchiolo, 16th RD50 Workshop Barcelona, Spain, May 2010 Even if non-uniformity of field across the implant is only 30%, a large fraction of the center of the implant does not exhibit charge multiplication !
Epi, short drift on planar diode g = 6.5 Using red laser and a’s probes E-field and gainclose to the junction, where it counts. Diode gives uniform field. Charge multiplication in 3D sensors: M. Koehler et al. J. Lange et al., Nucl.Instrum.Meth A622, 49-58, 2010. Need uniform field: 3D or diode-like
What about fast readout: • CERN fixed-target experiment (NA62) needs very fast pixel sensors: Gigatracker (GTK) • Prototype CFD system (INFN Torino) has ~ 100 ps resolution, predicted to be 30 ps in next iteration. • Optimized for 200mm sensors and hole collection (?), could it be re-designed for electron collection from 2 – 10mm sensors?
Firenze ps Laser Data: 50 um p-on-n 6kW-cm • Laser • 1.2 ps pulse width & 10 ns period: pulse distortions • 740 nm wavelength for red light, penetrate ~6 um. • Oscilloscope: 500 MHz bandwidth • 2 BNC into 50 Ohm, 500 Ohm in scope • Charge collection of electrons moving away from laser spot • Terminal velocity ~ 100um/ns, i.e. expected collection time ~500ps for high fields
Timing Properties of ps Laser signal Pulse is convolution of electronic shaping and charge collection, Fit pulses to extract shaping time trise & 10%-90% RTFWHM is considered best measure of the convolution FWHM becomes constant at about 150 V bias Rise times RT and trise are ~ independent of bias: Bandwidth of system
Collection of ps Laser signal Above 120V bias, the field > 25kV/cm, i.e. large enough to saturate the drift velocity, i.e. constant collection time. Below 120V bias, the unsaturated drift velocity increases the charge collection time, causing the pulses to widen.
Study of ’s from Thorium 230 50 um thick P-type epi diodes Challenge for manufacturers: For charge multiplication, need breakdown voltage >1000V!!
NIST Range Thorium 230: 4.7 MeV
Pulses from Th 230 alpha’s Do NOT expect: Charge multiplication Expect collection time of ~ 500ps for over-depleted bias (drift velocity is saturated) large rise time dispersion for low bias voltage
Thin Sensor Simulations Preliminary Results Colin Parker UCSC / UNITN 1/18/13
+ n p- epi + p substr. Doping Profiles & Biasing • Assume doping distributions with maximum 2 doping distributions, uniform in depth,“pad fields” • Explore two basic conditions: • Emax = 270 kV/cm, adjust bias -> maximum gain • Common Bias for pairs of distributions: all 100 W-cm vs. 100 W-cm with p+ implants of 5, 10, 20 W-cm(4um deep in 20 um, 2 um 5 um) • Thickness 20, 5 um • Resistivity 10, 50, 100, 1000 Ohm-cm
Emax = 270 kV/cm, (Bias adjusted), 5 mm [3um 100 W-cm + 2um of p+ implants (5, 10, 15 W-cm)] vs. [5um 100W-cm]
Emax = 270 kV/cm, (Bias adjusted), 5 mm [3um 100 W-cm + 2um of p+ implants (5, 10, 15 W-cm)] vs. [5um 100WW-cm] Shower development in Space Shower development in Time
Emax = 270 kV/cm, (Bias adjusted), 5 mm [3um 100 W-cm + 2um of p+ implants (5, 10, 15 W-cm)] vs. [5um 100W-cm] Gain vs. Resistivity Collected Charge vs. Resistivity
Emax = 270 kV/cm, (Bias adjusted), 20 mm [16um 100 W-cm + 4um of p+ implants (5, 10, 15 W-cm)] vs. [20um 10, 50, 100, 1000 W-cm]
Emax = 270 kV/cm, (Bias adjusted), 20 mm [16um 100 W-cm + 4um of p+ implants (5, 10, 15 W-cm)] vs. [20um 10, 50, 100, 1000 W-cm] Shower development in Space Shower development in Time
Emax = 270 kV/cm, (Bias adjusted), 20 mm [16um 100 W-cm + 4um of p+ implants (5, 10, 15 W-cm)] vs. [20um 10, 50, 100, 1000 W-cm] Gain vs. Resistivity Collected Charge vs. Resistivity
Common Bias of 100 W-cm Bulk and Implant, 5 mm [3um 100 W-cm + 2um of p+ implants (5, 10, 15 W-cm)] vs. [5um 100W-cm]
Common Bias of 100 W-cm Bulk and Implant, 5 mm [3um 100 W-cm + 2um of p+ implants (5, 10, 15 W-cm)] vs. [5um 100W-cm]
Common Bias of 100 W-cm Bulk and Implant, 20 mm [16um 100 W-cm + 4um of p+ implants (5, 10, 15 W-cm)] vs. [20um 100W-cm]
Common Bias of 100 W-cm Bulk and Implant, 20 mm [16um 100 W-cm + 4um of p+ implants (5, 10, 15 W-cm)] vs. [20um 100W-cm]
Collected Charge in 5 & 20 um [16um 100 W-cm + 4um of p+ implants (5, 10, 15 W-cm)] vs. [20um 100W-cm] [3um 100 W-cm + 2um of p+ implants (5, 10, 15 W-cm)] vs. [5um 10, 100, 1000W-cm]