Download
1 / 1
10 likes | 93 Vues
P-3.4 Wed. October 26, 2005. Motivation Quantify the impact of interannual SST variability on the mean and the spread of Probability Density Function (PDF) of seasonal atmospheric means. Abstract

E N D
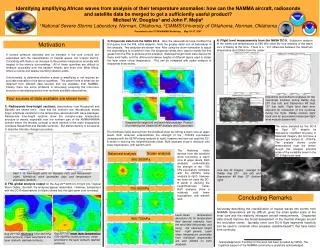
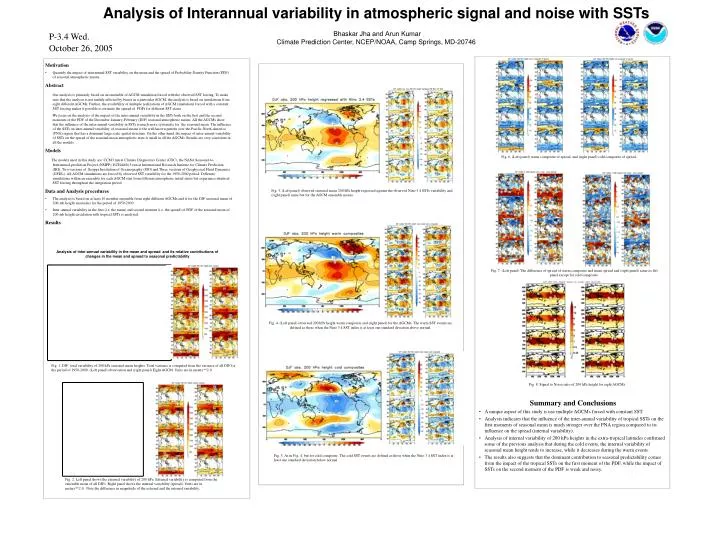
P-3.4 Wed. October 26, 2005 • Motivation • Quantify the impact of interannual SST variability on the mean and the spread of Probability Density Function (PDF) of seasonal atmospheric means. • Abstract • Our analysis is primarily based on an ensemble of AGCM simulation forced with the observed SST forcing. To make sure that the analysis is not unduly affected by biases in a particular AGCM, the analysis is based on simulations from eight different AGCMs. Further, the availability of multiple realizations of AGCM simulations forced with a constant SST forcing makes it possible to estimate the spread of PDFs for different SST states • We focus on the analysis of the impact of the inter-annual variability in the SSTs both on the first and the second moments of the PDF of the December-January-February (DJF) seasonal atmospheric means. All the AGCMs show that the influence of the inter-annual variability in SSTs is much more systematic for the seasonal mean. The influence of the SSTs on inter-annual variability of seasonal means is the well known pattern over the Pacific-North-America (PNA) region that has a dominant large scale spatial structure. On the other hand, the impact of inter-annual variability of SSTs on the spread of the seasonal mean atmospheric state is small in all the AGCMs. Results are very consistent in all the models. • Models • The models used in this study are: CCM3 run at Climate Diagnostics Center (CDC), the NASA Seasonal-to-Interannual-prediction Project (NSIPP), ECHAM4.5 run at International Research Institute for Climate Prediction (IRI), Two versions of Scripps Institution of Oceanography (SIO) and Three versions of Geophysical Fluid Dynamics (GFDL). All AGCM simulations are forced by observed SST variability for the 1950-2000 period. Different simulations within an ensemble for each AGCM start from different atmospheric initial states but experience identical SST forcing throughout the integration period. • Data and Analysis procedures • The analysis is based on at least 10 member ensemble from eight different AGCMs and is for the DJF seasonal mean of 200-mb height anomalies for the period of 1950-2000. • Inter-annual variability in the first (i.e. the mean) and second moment (i.e. the spread) of PDF of the seasonal mean of 200-mb height circulation with tropical SSTs is analyzed. • Results Analysis of Interannual variability in atmospheric signal and noise with SSTsBhaskar Jha and Arun KumarClimate Prediction Center, NCEP/NOAA, Camp Springs, MD-20746 Fig. 6. (Left panel) warm composite of spread, and (right panel) cold composite of spread. Fig. 3. (Left panel) observed seasonal mean 200 hPa height regressed against the observed Nino 3.4 SSTs variability and (right panel) same but for the AGCM ensemble means. Analysis of inter-annual variability in the mean and spread and its relative contributions of changes in the mean and spread to seasonal predictability Fig. 7. (Left panel) The difference of spread of warm composite and mean spread and (right panel) same as left panel except for cold composite. Fig. 4. (Left panel) observed 200 hPa height warm composite and (right panel) for the AGCMs. The warm SST events are defined as those when the Nino 3.4 SST index is at least one standard deviation above normal. Fig. 1. DJF total variability of 200 hPa seasonal mean heights. Total variance is computed from the variance of all DJF for the period of 1950-2000. (Left panel) observation and (right panel) Eight AGCM. Units are in meters**2.0. Fig. 8. Signal to Noise ratio of 200 hPa height for eight AGCMs. • Summary and Conclusions • A unique aspect of this study is use multiple AGCMs forced with constant SST. • Analysis indicates that the influence of the inter-annual variability of tropical SSTs on the first moments of seasonal mean is much stronger over the PNA region compared to its influence on the spread (internal variability). • Analysis of internal variability of 200 hPa heights in the extra-tropical latitudes confirmed some of the previous analysis that during the cold events, the internal variability of seasonal mean height tends to increase, while it decreases during the warm events. • The results also suggests that the dominant contribution to seasonal predictability comes from the impact of the tropical SSTs on the first moment of the PDF, while the impact of SSTs on the second moment of the PDF is weak and noisy. Fig. 5. As in Fig. 4, but for cold composite. The cold SST events are defined as those when the Nino 3.4 SST index is at least one standard deviation below normal. Fig. 2. Left panel shows the external variability of 200 hPa. External variability is computed from the ensemble mean of all DJFs. Right panel shows the internal variability (spread). Units are in meters**2.0. Note the difference in magnitude of the external and the internal variability.