Download
1 / 22
220 likes | 308 Vues
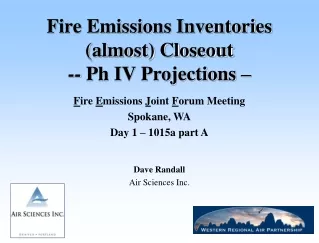
2005 Progress on Emissions Inventories. Attribution of Haze Workgroup Meeting January 24, 2006. Scope of regional technical effort. Analyze significant regional components of haze Large, regionally ubiquitous sources and impacts

E N D
2005 Progress on Emissions Inventories Attribution of Haze Workgroup Meeting January 24, 2006
Scope of regional technical effort • Analyze significant regional components of haze • Large, regionally ubiquitous sources and impacts • Provide consistent, comparable, and reproducible regional analyses • Interstate consultation regarding the emissions contributions of states and tribes to each Class I area • Assessment of the visibility improvement from adopted and proposed control strategies at each Class I area within and downwind of the WRAP region
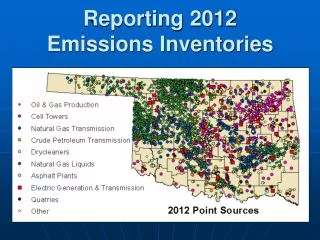
WRAP Region Emissions Inventories • 2004-05 comprehensive, quality-assured EI-building efforts to support regional haze planning – work completed 12/05 • Point and area • Mobile • Fire • Dust • Biogenics/Ammonia • Time periods • 2002 • 2000-04 • 2018 base case • Using EIs for all source categories as provided by other RPOs east of WRAP as is, no effective way to independently QA, followup work needed to better understand CENRAP data
Emissions Issues to Consider • What and where are the contributing emissions? • Natural vs. anthropogenic emissions • How are those related to baseline monitoring data? • How will the temporal and spatial patterns change by 2018? • What are the changes in emissions by source category: 2002 to 2018? • What have we achieved in terms of completeness and representativeness of the emissions inventories? • How are we doing on tribal emissions inventories? • What are the limitations/problems/remaining challenges with the emissions?
Progress on Emissions Inventories • There are standard methods for some source categories – WRAP has improved/QAed • Point, area, on- and off-road mobile, biogenics • First regional EI for oil and gas production and distribution • Area sources are generally poorly resolved • Inventory methods have been developed by WRAP for some categories. Have received broad review and application • Fire • Ammonia • Windblown dust • Commercial marine and off-shore shipping • More than 25 tribes now have EIs
WRAP Region EIs • Point and area sources – 2002 & 2018 (SSJF/EF/TDDWG project) • Based on state/local/tribal 2002 EIs prepared to date – • QA by ERG (contractor), then review by agency preparing those data • 2002 data are most complete and representative of 2000-04 regional haze baseline period • Covers all criteria pollutant EIs from permitted sources • Point vs. area source thresholds vary by state • Important in developing first regional oil & gas NOx EI • Area sources include ag and construction dust • Point and area sources – 2018 • Projected from QAed 2002 data by ERG, again reviewed by agency • Includes new sources projected by EGAS model, accounts for population and economic growth, source retirements, and permits/consent decrees on the books by the end of 2004 • Does not include future BART emissions reductions/other control programs
WRAP Region EIs • Mobile Sources – 2002 – represents 2000-04 period • On-road EIs prepared using Mobile 6.1, using state/local VMT data • Off-road EIs prepared using NONROAD2004, using state/local activity data • Planes/trains/port activities using regionally-consistent methods • Off-shore shipping uses CARB/Corbett methods • Mobile Sources projected to 2008, 2013, and 2018 from 2002 EIs • Accounts for all federal/state/local mobile control programs on the books through the end of 2004
WRAP Region EIs • Fire Emissions – different scenarios to address the spatial and temporal variability in fire emissions • Phase I/II – 2-step project to QA/develop ACTUAL fire emissions for 2002 – used in model performance evaluation • Phase III – uses Phase II EI to develop 2000-04 fire EIs that are “typical/representative/average”, keeps fires at same locations but scales back emissions to 5-year averages • Phase IV – projects fire scenarios in 2018 from Phase III fire EI, based on present fuel loading conditions and FLM fire use plans/projections • Dust Emissions - point/ag/construction dust in point/area EI project • Road dust 2002 and 2018 based on regionally consistent method, using VMT data from states/locals • Windblown dust developed for 2002 only, estimated using winds in regional air quality model, held constant to 2018 • Biogenics/Ammonia • Estimated from BEIS3 and WRAP ammonia emissions models, respectively, both use meteorology in regional air quality model, held constant to 2018 • Point/area/all mobile source ammonia emissions estimated in those projects
- Tribes with EI data prepared and released as of December 6, 2005
WRAP Region NOx Emissions 2002 to 2018 Base Case Total: 2002 = 4,037,715 2018 = 2,872,346
WRAP Region SO2 Emissions 2002 to 2018 Base Case Total: 2002 = 1,023,797 2018 = 969,107